







If your social media reach dropped recently, you are not alone. Many creators and business owners find their views cut in half, even when posting the same type of content.
This happens because social platforms have changed how they deliver content.
Today, they rely on AI recommendation feeds. They choose which posts to push based on content interest rather than account size.
Before getting into which social media metrics to track, I feel it would be an oversight on our part if we don’t talk about two things: AI and short-form videos.
How social media algorithms use AI to recommend content
To track the right metrics, it helps to understand how modern feeds determine what people see.
Platforms no longer deliver posts based only on follower lists. Instead, they test every new post with a small group of active users first.
If those initial viewers watch your post and interact with it, the system pushes it out to a larger audience. If people scroll past quickly, distribution stops.
Basically: Post published ➔ Tested on small audience ➔ AI measures reaction ➔ Distributed to wider feed
This testing process happens automatically every time you publish a new post.
What are the key metrics for short-form content?
When evaluating your TikTok or Reels, the algorithm pays attention to a few main signals:
- Hook rate: The percentage of people watch past the first few seconds of your video.
- Watch time and scroll speed: How long a person stops to look at your post before moving on.
- Past user interest: How often a person interacts with similar topics across the platform.
- User interactions: Whether a user frequently saves, shares, or comments on your type of content.
In their official guide on how TikTok recommends videos, the platform notes that video completion and shares carry much more weight than account size. A new account with zero followers has a fair chance to reach people if its content creates strong watch time.
Why short video became central to AI recommendations
Platforms like Instagram, TikTok, and Facebook now heavily push short vertical video because it gives AI engines clear signals in real time.
When someone looks at a static photo, the app only gets one or two clear signals. Short video offers far more data.
During a 30 second video clip, the algorithm tracks:
- The exact moment a viewer scrolls away
- Whether someone watches the video a second time
- How many people DM the clip to a friend
This constant stream of data helps social networks update feed recommendations instantly.
According to Instagram’s ranking guide, watch duration and completion rates on Reels directly det
ermine if a post makes it to the main discovery feed.
So, whether you are trying to sell a product or become a creator, you’re basically forced to jump onto this trend in order to reach new audiences.
12 social media metrics to track and optimize in 2026
Now that we have discussed the changes as of 2026, let’s see the key social media metrics you should track.
Social media performance metrics
These six metrics signal to the platform that your content is engaging and worth sharing with more people.
1. Watch time
Watch time is the total amount of time people spend watching your video.
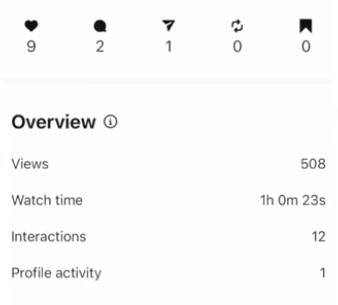
Platforms reward high watch time because keeping users inside the app longer creates more opportunities to display ads.
2. Video completion rate
Video completion rate is the percentage of viewers who stay until the very last second of your clip.
Video completion rate is very important on TikTok’s For You Page (FYP) and Instagram Reels during the initial algorithmic testing phase. When you publish a video, the algorithm shows it to a small sample audience. If a high percentage of those viewers watch to the end, the system pushes the video out to a broader feed.
For 15-second to 30-second videos, aim for a completion rate between 40% and 50%. For videos over 60 seconds, a completion rate above 20% to 30% is considered solid.
Keep in mind that shorter videos naturally achieve higher completion rates, so compare completion rates among videos of similar lengths.
3. Shares
Shares (especially DM shares) are important, yet underrated metrics for Instagram. When a user sends your post to a friend through a private message, it signals to the platform that your post is relevant to share with strangers.
4. Save rate
Save rate counts how many people bookmark your post to look at again later. Educational posts and practical tips often get high save rates.
Saves represent intentional user action. While liking a post takes minimal effort, saving a post shows that your content has lasting utility, such as a recipe, a tutorial, or a checklist. Posts with high save rates often enjoy a longer shelf life in recommendation feeds, continuing to gain views weeks after publication.
5. Reach and Impressions
Reach shows the number of unique accounts that saw your post, while impressions count the total number of times your post appeared on screen.
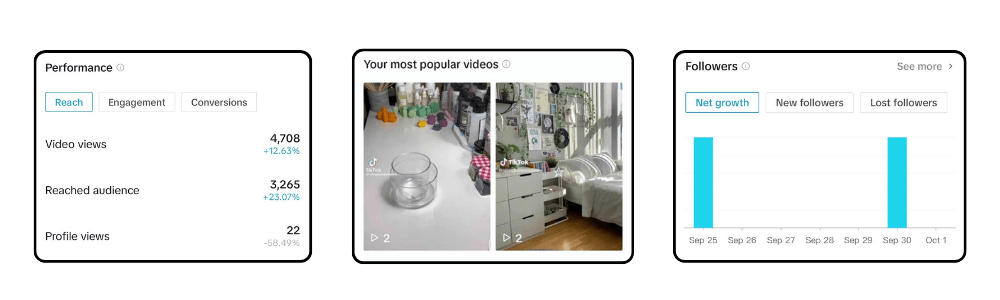
Dashboards label these as Accounts Reached and Impressions on Instagram, Facebook, and LinkedIn, while TikTok and YouTube refer to total impressions primarily as Total Video Views.
On short video feeds, you want non-follower reach to make up more than 50% of your total reach, which proves your content is breaking into recommendation feeds. The difference between the two is simple: if one user views your video three times, your dashboard logs 1 for Reach and 3 for Impressions.
6. Follower growth
New followers measure the net number of accounts that hit the follow button directly after viewing your post. In short, you measure how many followers you gain after a campaign or over a period of time. This is a great indicator of your marketing effort, how much your content resonates with the audience.
Today, AI shows your posts to people who do not follow you, but follower growth remains a critical metric. It is no longer just a measure of reach — it is a measure of retention, brand authority, and community strength.
Some may consider it your content’s conversion rate. A growing follower count proves that your content is turning random viewers into long-term audience.
Social media ROI metrics
Organic views are great, but they need to support your business goals. These six ROI metrics help you measure financial return.
7. Outbound click through rate
This metric tracks the percentage of viewers who click a link in your bio, story, or post to visit your website. It shows whether your content creates enough interest to move people off the social app.
A high view count with a low outbound click rate tells you that your content captured attention, but your call to action or link placement was weak, or your content is more geared for entertainment rather than what you are offering on your website.
8. Conversion rate
Conversion rate tracks the percentage of social media visitors who complete a specific goal on your site, such as signing up for an email newsletter or buying a product.
For general traffic coming from social channels, a conversion rate between 2% and 3% is considered a healthy baseline, while lead generation or email opt-in pages typically target 10% to 15%.
If you see high website traffic and want to increase social media conversion rate, check what your social post promised and what your website landing page delivers, or a complex checkout process.
9. Cost per click
If you run paid posts alongside your organic efforts, cost per click tells you the exact price you pay for every visitor sent to your site. Average CPC ranges from $0.50 to $2.00 on consumer platforms like Meta and TikTok, whereas B2B targeting on LinkedIn often ranges from $5.00 to $12.00 due to the higher financial value of professional audiences.
Watching this number helps you catch creative fatigue, meaning your target audience has seen your ad visual too many times and it is time to refresh your content.
10. Website traffic
Website traffic measures the total volume of visits and unique sessions sent to your site directly from your social media channels.
You can monitor this primarily inside Google Analytics 4 under the Acquisition reports, where social sources appear as organic social or paid social.
Tracking website traffic gives you a macro view of how much top-of-funnel interest your social media presence generates over weeks and months. When analyzing website traffic, pay close attention to session duration and bounce rate alongside total visitor counts, because getting 5,000 visitors who leave within two seconds is far less valuable to your business than getting 500 engaged visitors who browse multiple pages on your site.
11. Return on ad spend (ROAS)
Return on ad spend measures the revenue earned for every dollar spent on paid social promotions. A return of 3x means you made three dollars back for every dollar spent.
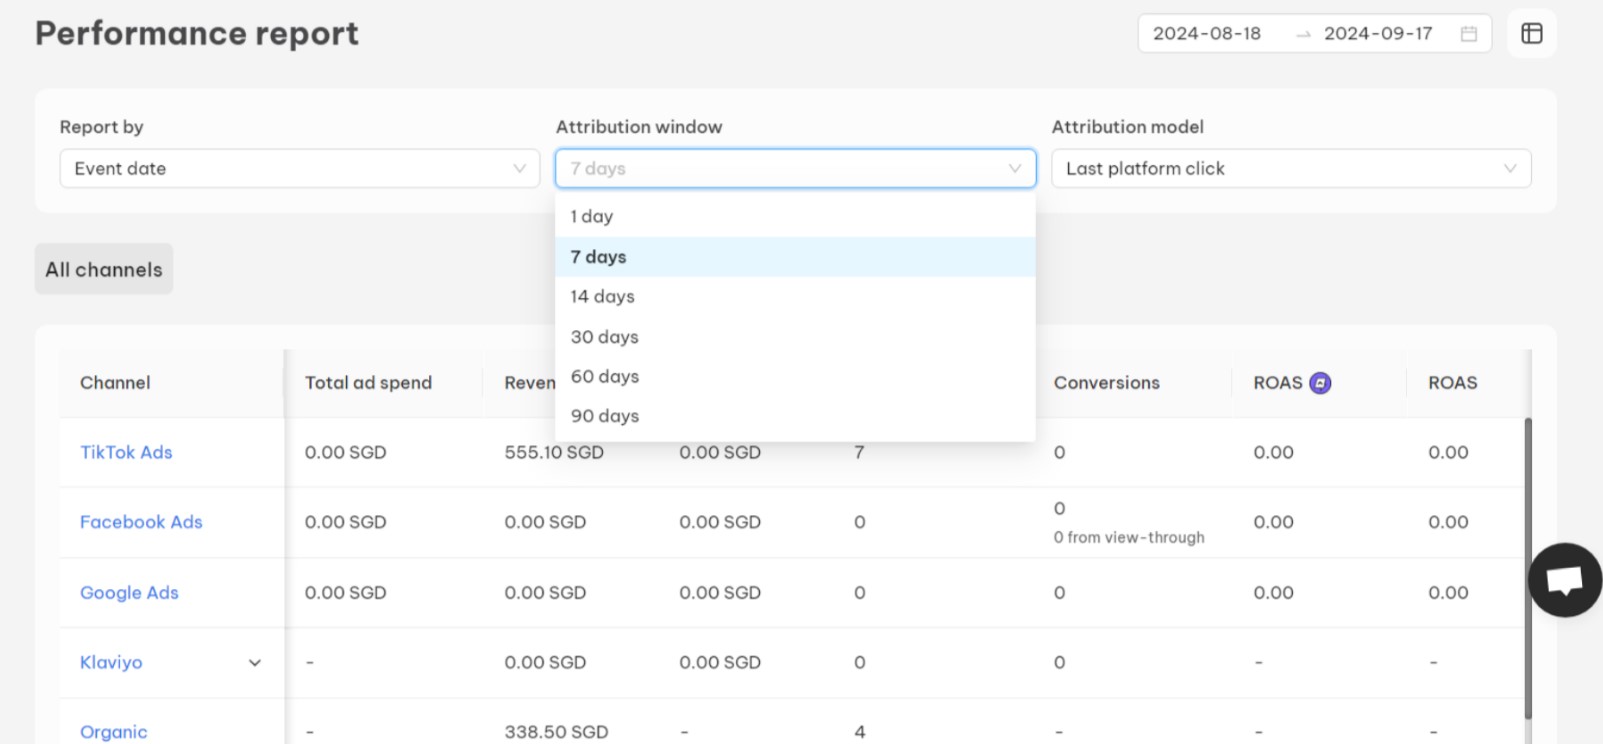
Your ad dashboards and Google Analytics 4 calculate this by dividing total ad revenue by total ad spend. A ROAS of 3x means you made three dollars back in revenue for every single dollar spent on ads, which is generally considered a solid, sustainable target for a campaigns.
However, it is important to remember that ROAS measures top-line revenue rather than net profit margin. A 3x ROAS might be highly profitable for a digital product with no manufacturing costs, but unprofitable for a physical product with high shipping, inventory, and labor costs.
12. Brand mentions
Brand mentions track how many times users, publications, or other creators tag your account or talk about your brand name across social platforms.
You can view these through dedicated social listening tools. Tracking brand mentions helps you gauge overall brand awareness, public sentiment, and share of voice within your industry. An increase in organic brand mentions often correlates with higher direct search traffic on Google and long-term customer trust, showing that your social content is building a real word-of-mouth reputation rather than just passive views.
Tools to track social media metrics and optimize your strategies
Tracking your metrics consistently becomes much easier when you put the right tools in place. Depending on your budget and business size, you can choose between free native platforms and paid analytics software to monitor your performance and refine your strategy.
Free social media marketing tools
You do not need a large budget to start measuring what matters. Built-in native tools like Instagram Insights, TikTok Analytics, YouTube Studio, Meta Business Suite, and LinkedIn Analytics offer detailed data on watch time, completion rates, shares, and audience reach at zero cost.
For tracking business outcomes, Google Analytics 4 is essential for measuring website visits and sales generated by social traffic. When you combine Google Analytics 4 with Google’s free Campaign URL Builder to create custom UTM links, you can see exactly which social post drove a specific purchase or email sign-up.
Paid tools for deeper insights and scaling
As your social media presence grows, paid tools can save time by consolidating multi-platform data and tracking competitor benchmarks.
All-in-one management tools like Metricool, Buffer and Hootsuite gather performance metrics across all your accounts into unified dashboards, allowing you to schedule posts and generate clear reports in one place.
If you want to specifically track ads performance, you can try NestAds which shows ROAS across platforms and offers creative analysis.
Overall, you don’t need to use too many tools. Consider the platform’s analytics and GA4 a good starter pack, than branch out to other tools based on your goals, such as automation or ads tracking.
FAQs about Social Media Metrics
To measure engagement, divide your total post interactions like comments, shares, and saves by your overall reach and multiply by 100. Focus primarily on shares and saves, as recommendation algorithms weigh these actions far more heavily than passive likes.
Your report should highlight core performance metrics like watch time, shares, and new followers alongside business ROI numbers like website traffic and conversions. Keep it focused on actionable insights that connect your content strategy directly to business growth.
An algorithm update is likely if your account sees a 40% to 50% reach drop across five consecutive posts while your content quality stays the same. You can confirm an update if other creators in your niche report identical performance drops during the same week.
Start by checking your account status in app settings for active guideline flags, then pause third-party schedulers to post directly inside the app. Review your top-performing videos from recent months and test those proven hooks and formats again.