TikTok has become a global phenomenon, offering a huge opportunity for brands to connect with audiences all around the world. However, to truly thrive on TikTok, truly understand how to work effectively on this platform. And using TikTok Analytics is a great way to uncover valuable information about your content performance and your audience.
Throughout this blog, we will explore the key metrics and tools that TikTok provides to help you measure and analyze your performance. Furthermore, we’ll show you how you can make use of TikTok Analytics to gain more data-driven insights for your next TikTok campaign. So, let’s get started!
What is TikTok Analytics?
TikTok Analytics presents creators with the opportunity to optimize their content for enhanced engagement and wider reach. How does it accomplish this? By enabling brands to track TikTok insights into data like follower count, an overview of an account profile, and video analytics. This valuable data allows creators to make informed decisions and refine their content strategy for better results.
Inside TikTok Analytics, you can take a look at the TikTok Statistics. These built-in stats from TikTok are essential to helping brands visualize their performance and growing their TikTok account.
Who can view TikTok Analytics?
A small update is that TikTok has provided Analytics for both Creators and Businesses. However, they aren’t the same. Creator Analytics only provides key metrics like Video views and Followers. However, Business Analytics offers more in-depth insights on Reach, Engagement, and Conversion.
Therefore, if you’re an e-commerce business on TikTok, we recommend switching to TikTok for Business for comprehensive analytics. This blog will also focus on how you can utilize TikTok Analytics in your marketing activities for the best result.
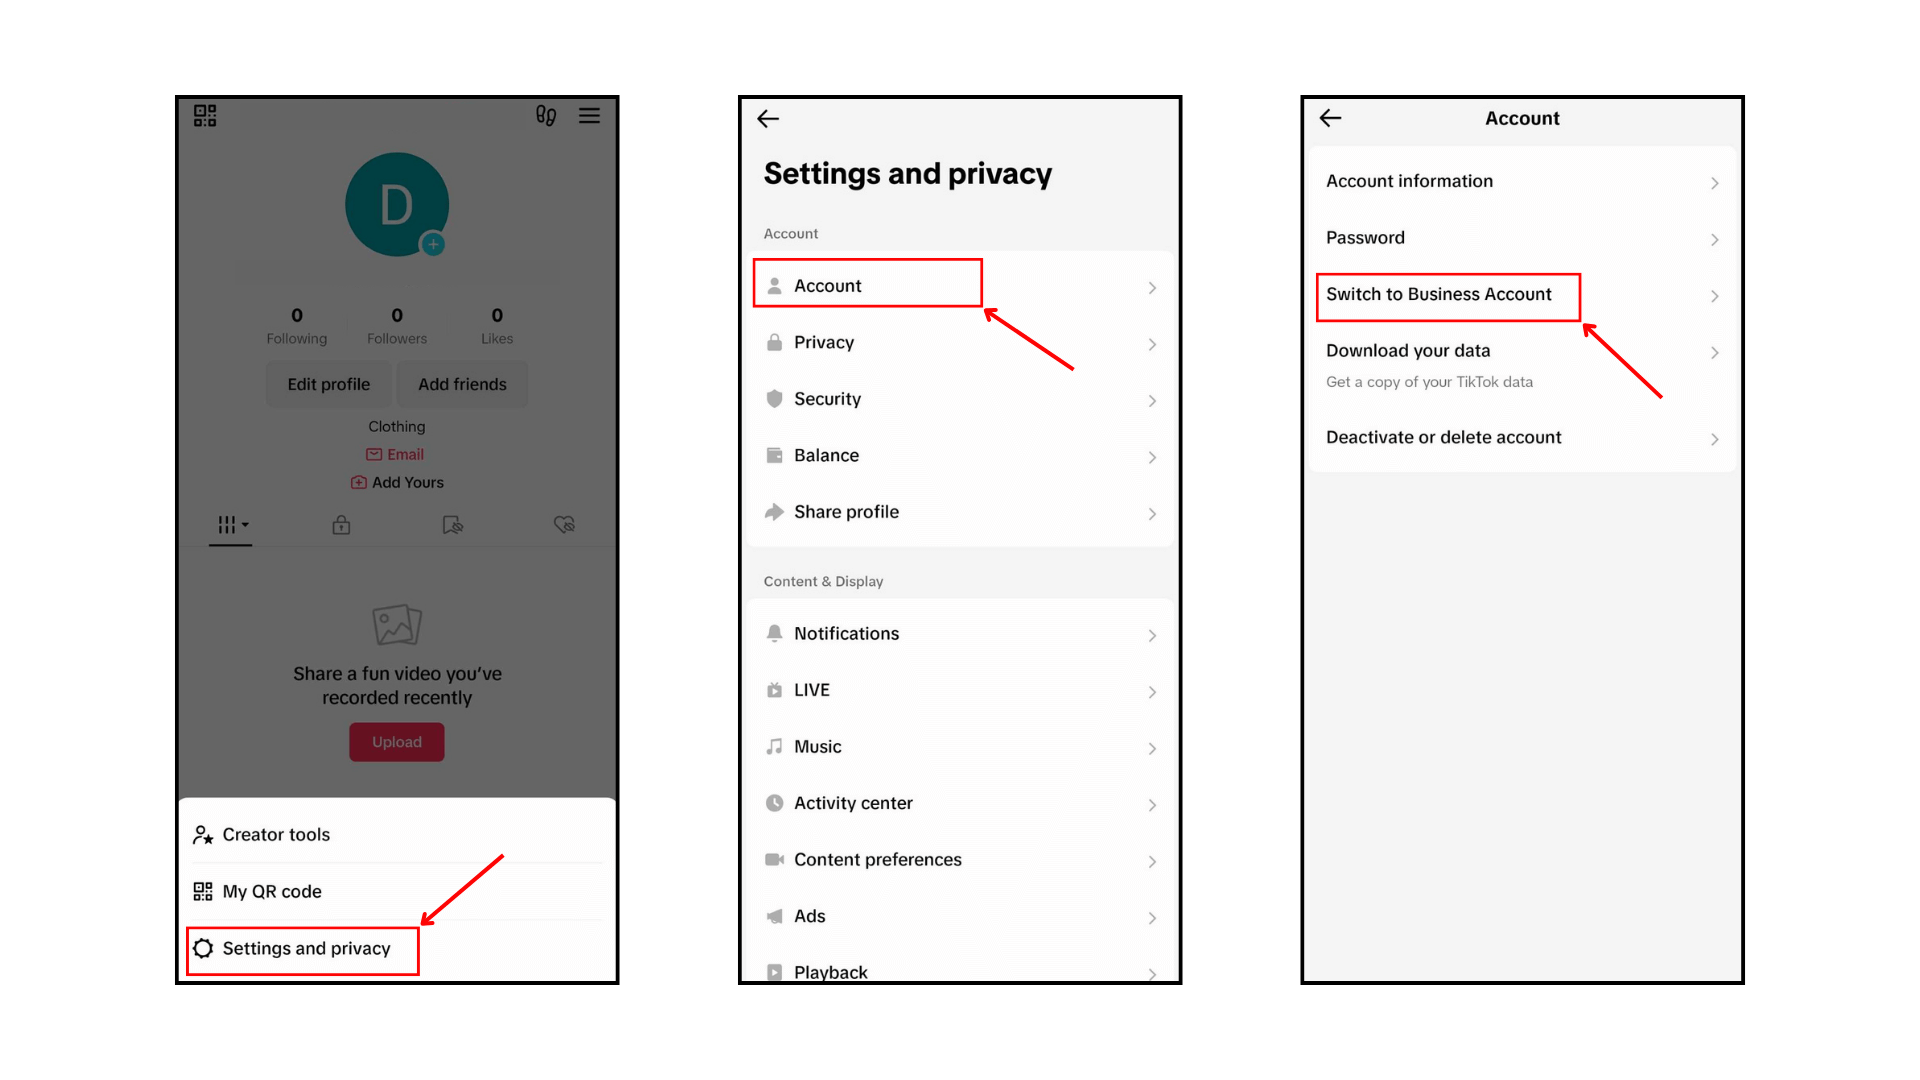
You can change your account settings on both mobile and desktop in just a few simple steps.
- On mobile, go to your TikTok app. Then, in your Profile, select the three-line icon on the top right corner of your screen. Then, tap on Settings and Privacy.
- Next, In your Settings and Privacy, go to Account.
- Finally, tap on Switch to Business Account. Then, simply choose your business category, add your email and your account will be set up.
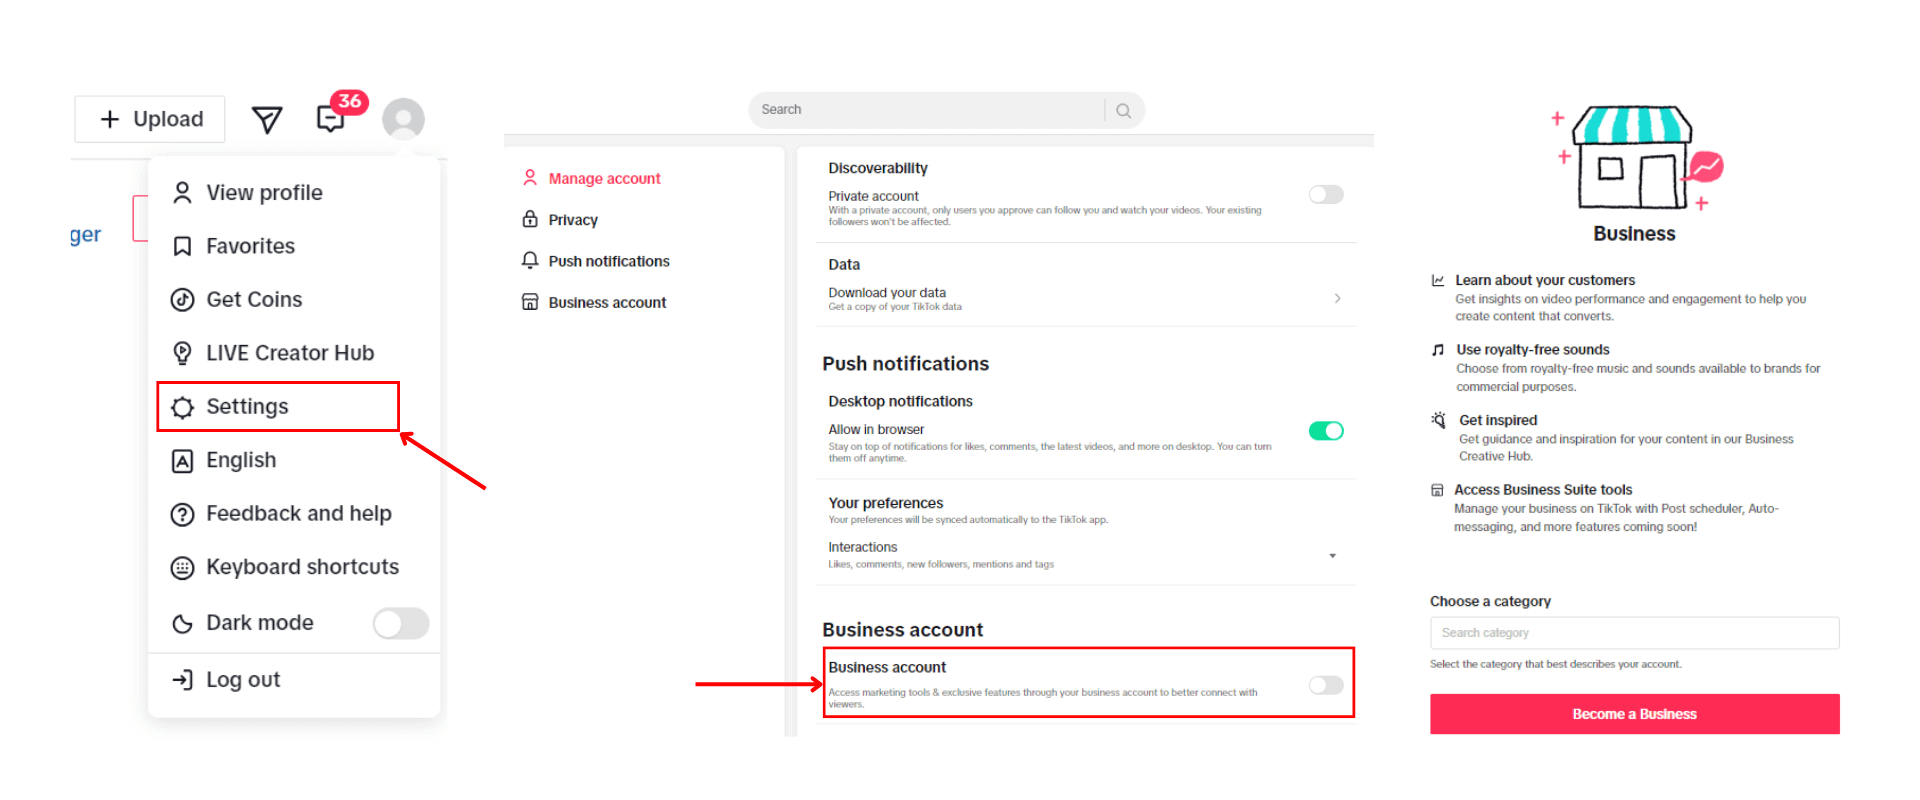
Alternatively, if you are more comfortable working with TikTok on your desktop, you can follow the instructions below:
- On your desktop, go to your account through the TikTok login website.
- Click on your profile at the right top corner of your screen. Then, select Settings.
- Scroll down to the bottom of the page, then switch on the Business account toggle
- Choose your business category. Lastly, click on Become a Business
How to use TikTok Analytics
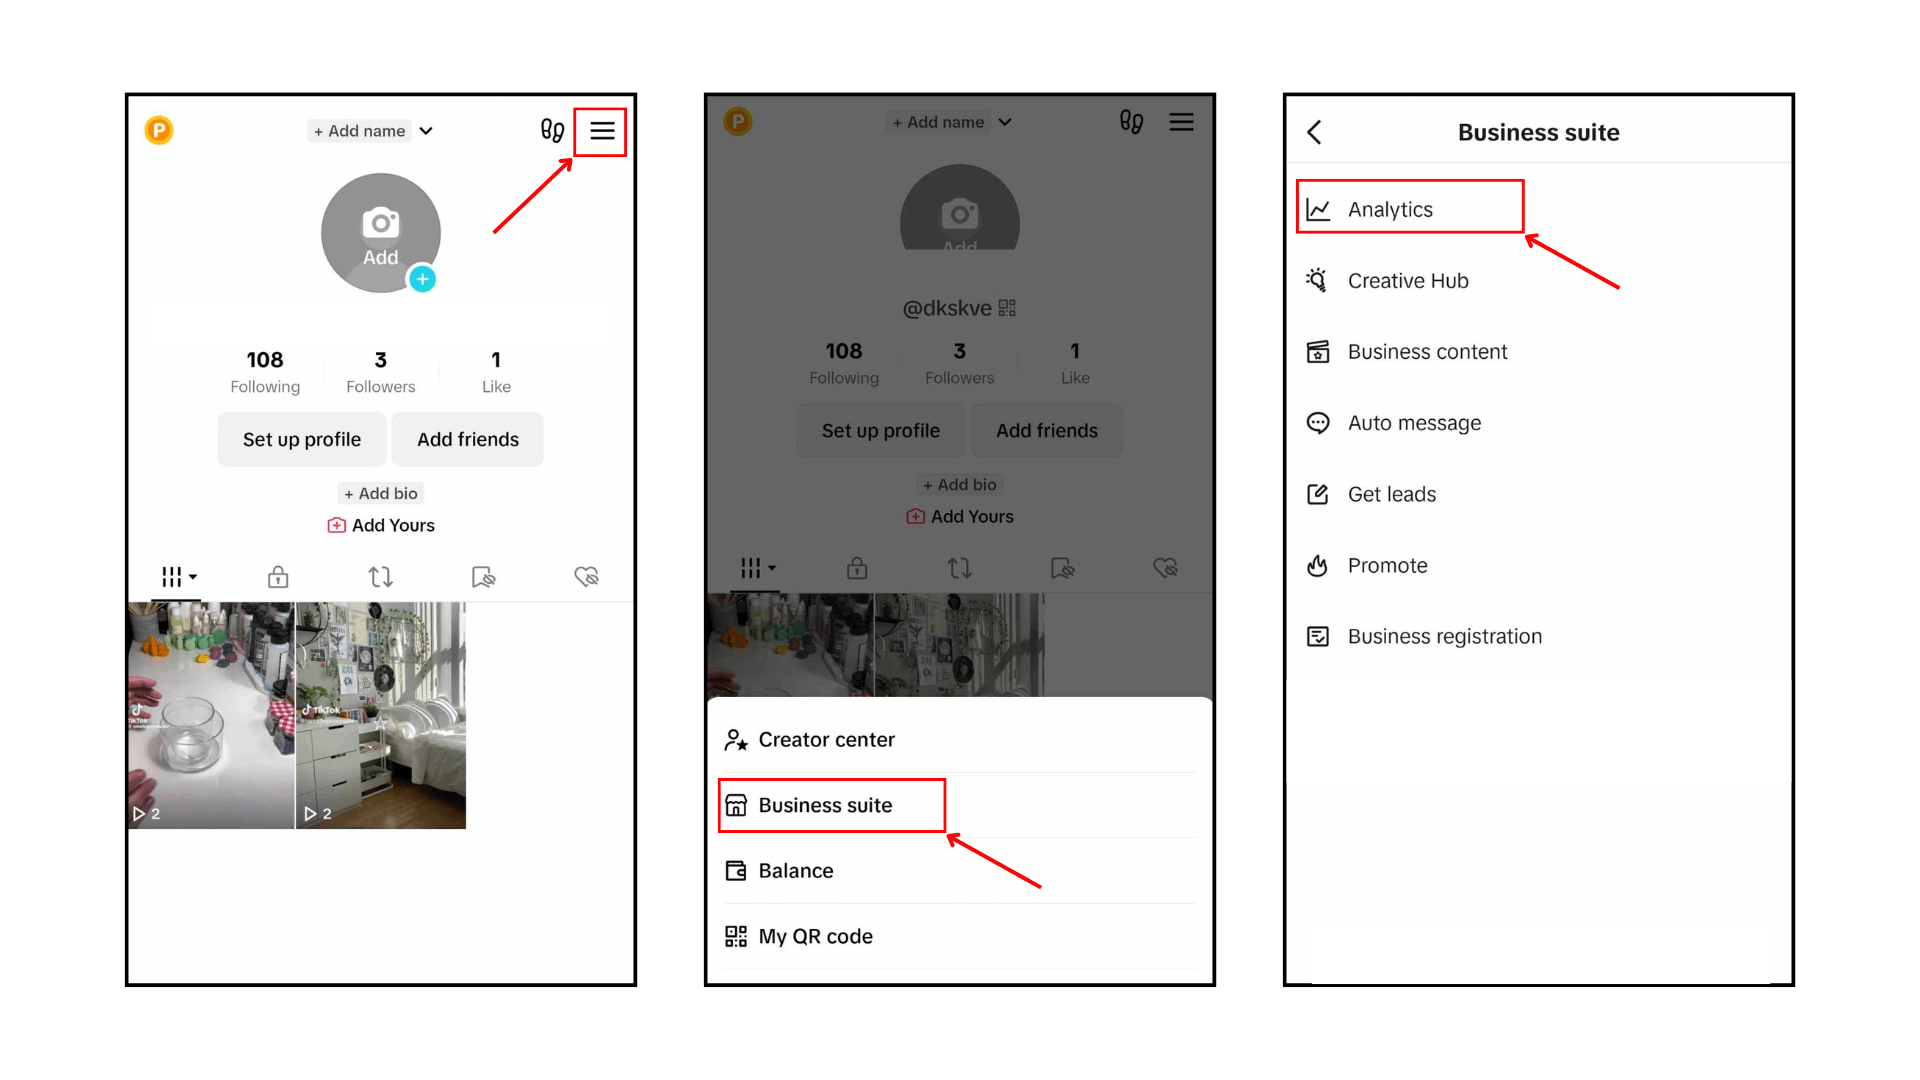
Now, after having switched to TikTok for Business, you will be able to gather all the in-depth analysis regarding your content and audience. To see these insights, check out the steps below:
On mobile
- Tap on the three dots in the right corner of your profile.
- Then, select Business suite. You’ll find various tools to help you manage and grow your account.
- Finally, choose Analytics to get to the analytics overview.
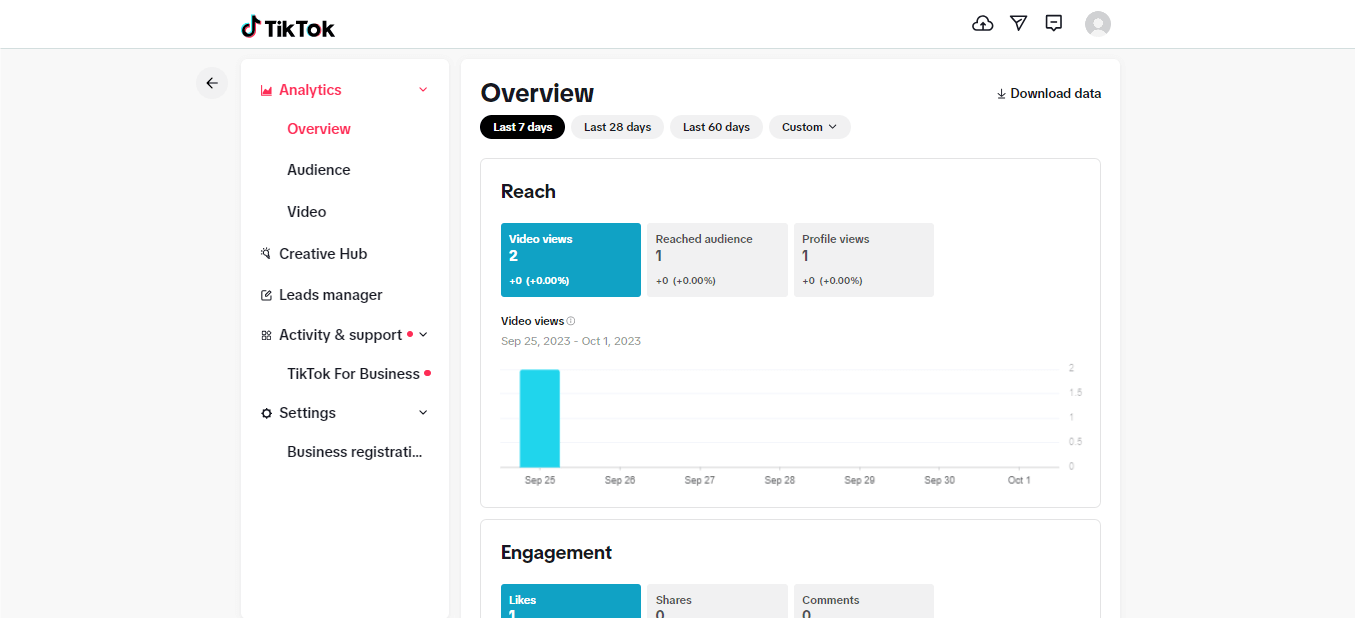
On desktop
- Move the mouse over your profile picture, then click on Business Suite
- Choose Analytics to view your performance analytics.
How to check TikTok analytics?
According to our latest update about TikTok Analytics, there are four primary categories for you to explore: Overview, Video, Audience, and LIVE. Each category offers distinct functionalities and insights.
TikTok Account overview
After clicking on Analytics, you’ll land on the overview page. The first thing you’ll see is the Performance section, where you can track your video’s performance and its results. This Performance section is divided into three smaller categories, offering a detailed look at how your content is performing at each stage of the audience journey.
- Reach: Gives you the metrics Video views, Reached audience, and Profile views
- Engagement: Provides you the total numbers of Likes, Comments, and Shares you receive from your published video
- Conversions: Including Phone number clicks and Lead submissions
Below the Performance section, you will see Your most popular videos, where the top performing videos with most video views within the selected time window will be showcased.
At the bottom of the Overview page, you’ll find a report on your Followers. It includes information on Net growth, New followers, and Lost followers. If you want to dig deeper into your followers’ activity and demographics, simply click See more for additional insights.
By default, the time window is set for a 7-day period. But if you want to get a better sense of how your business is performing over a longer timeframe, you can easily adjust the settings to show data for up to 60 days. This feature can be really helpful in tracking your progress and identifying areas for improvement over time.
TikTok Video Analytics
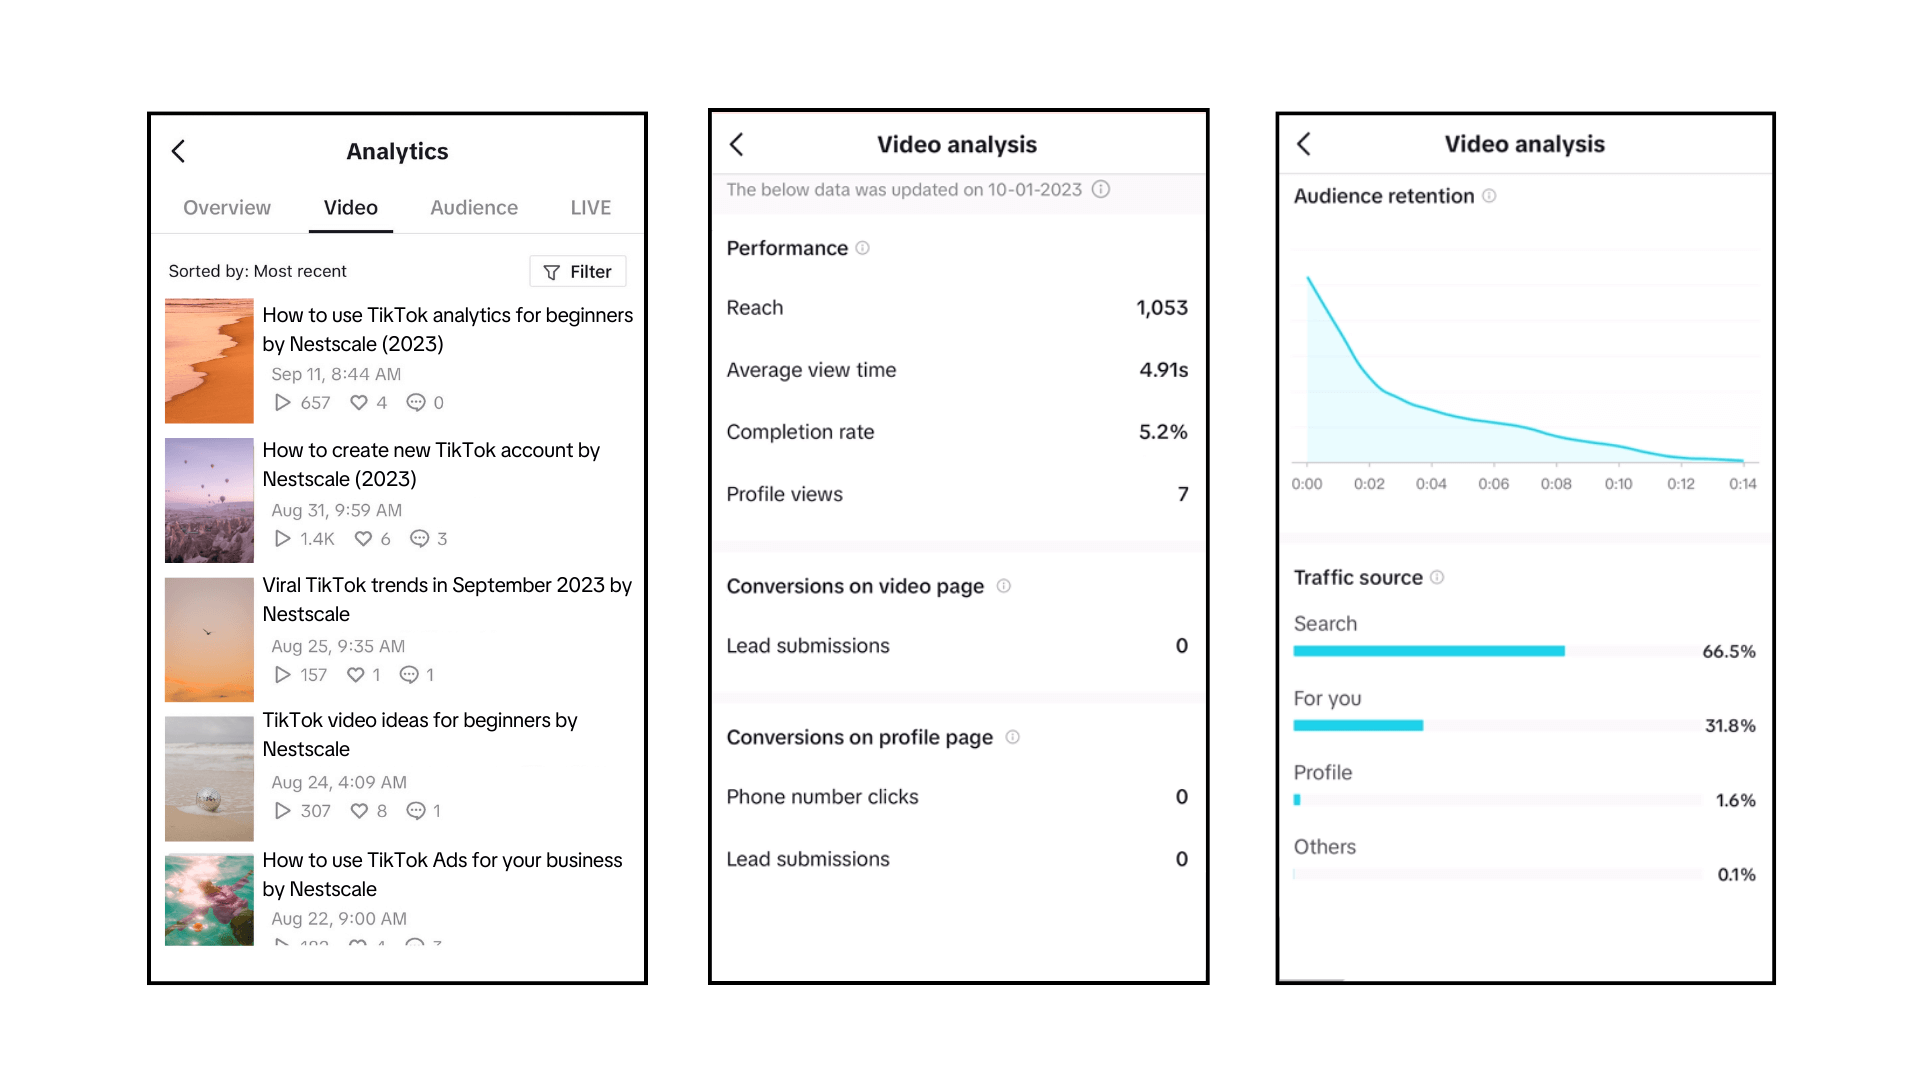
When you click on the Video page, you’ll find a list of all the videos you’ve posted. To get more details about the performance of a specific video, simply click on the one you want to view. TikTok Analytics will then take you to a separate page with comprehensive insights on different aspects, including:
- Performance: Includes video’s Reach, Average view time, Completion rate, and Profile view
- Conversions on video page: Gives you the number of Lead submissions
- Conversion on profile page: Shows you the figure for both Phone number clicks and Lead submissions
- Audience retention: Shows you how many of your viewers are still watching after an amount of time
- Traffic source: Whether your traffic comes from Search, For You Page, Profile, or Other sources
- Viewer insights: Shows you the distribution of viewers by gender, age, and their locations
By analyzing these statistics for each of your videos, you can gain insights into which ones are performing well and adjust your content strategy accordingly to optimize engagement on your account.
TikTok Audience Analytics
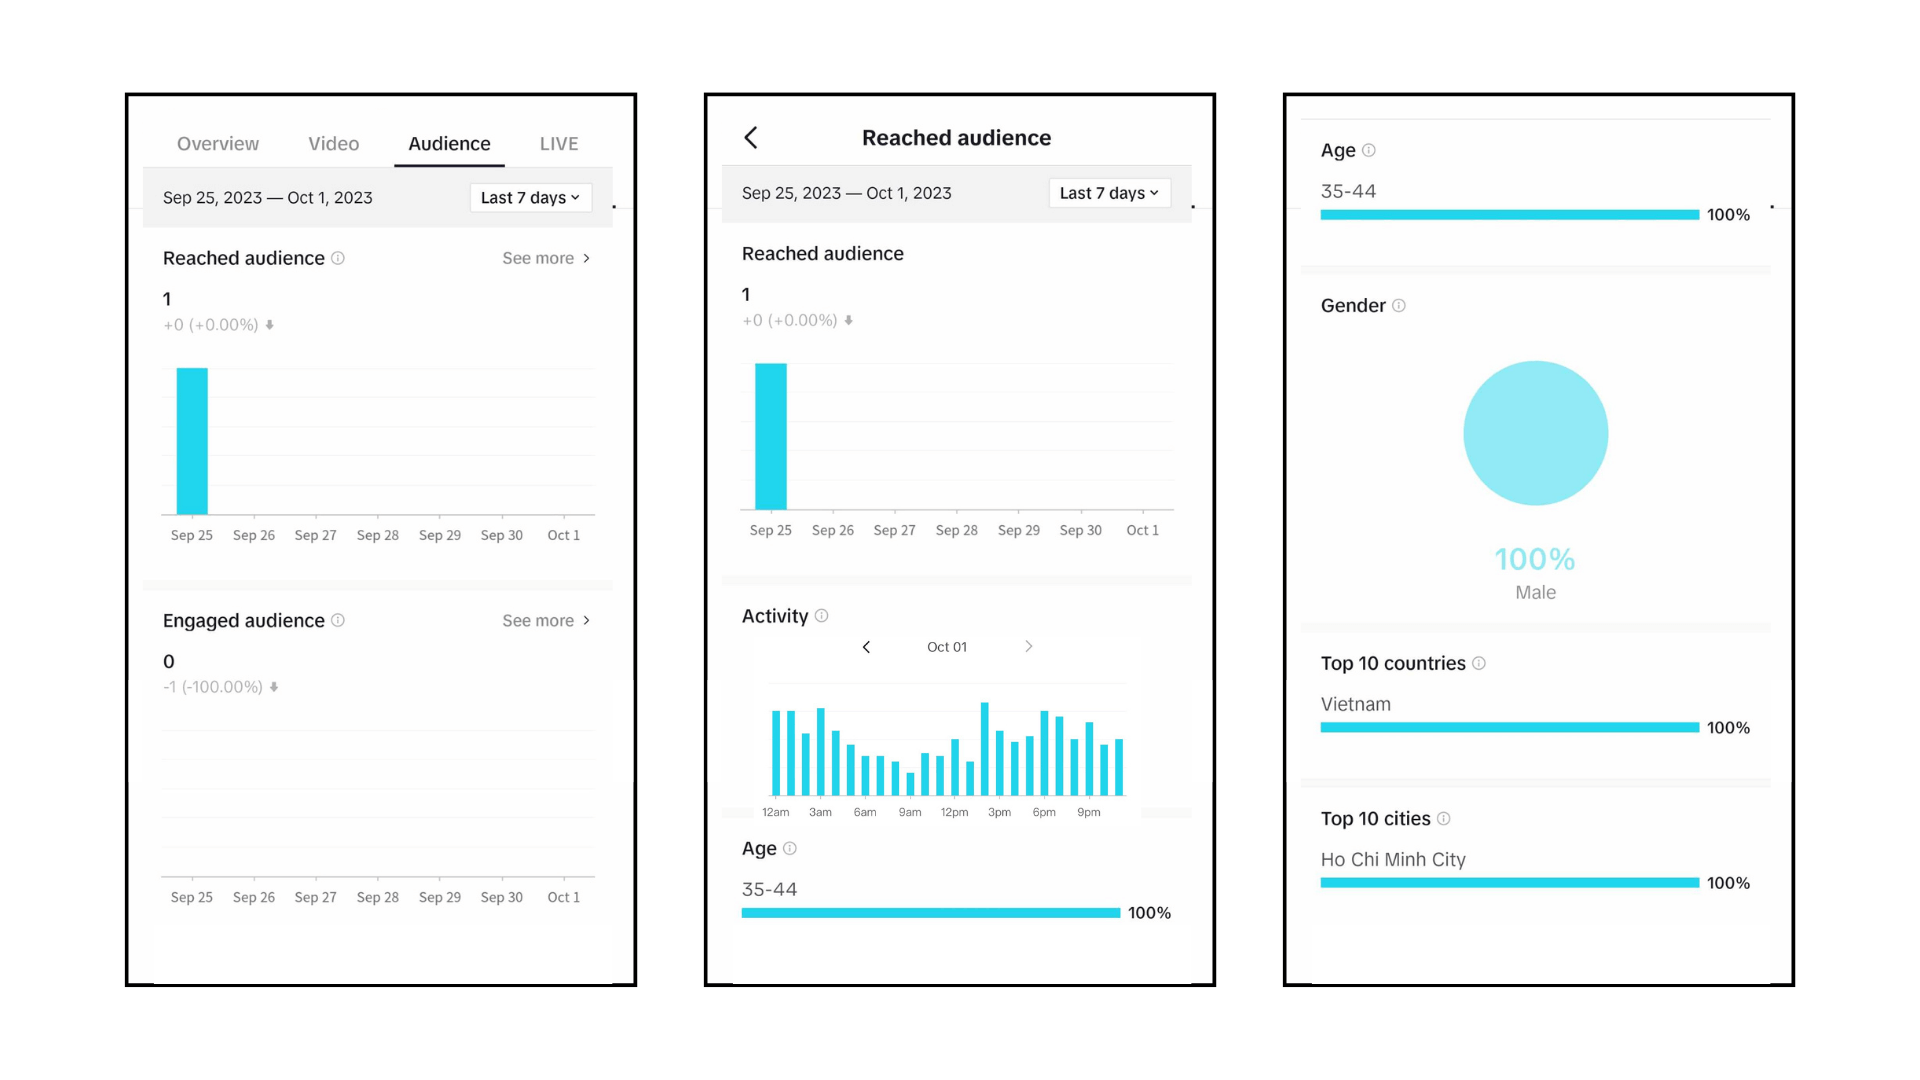
Audience Analytics page gives you the illustration number and graphic regarding to your Reached audience and Engaged audeince, where:
- Reached audience: The people who watched you video at least one
- Engaged audience: The people who interact with your video (Liked, commented, or shared) with at least on of your published content
Please note that the main TikTok Audience analytics provides a general overview and audience growth trends over time. For more detailed information about your audience’s activity and demographics, click See more. TikTok will then provide detailed analysis for each dimension, including age, gender, and location.
Knowing these insights can help you adjust your content to cater more to your main target audience; and know what is the best time to upload your content
TikTok LIVE analytics
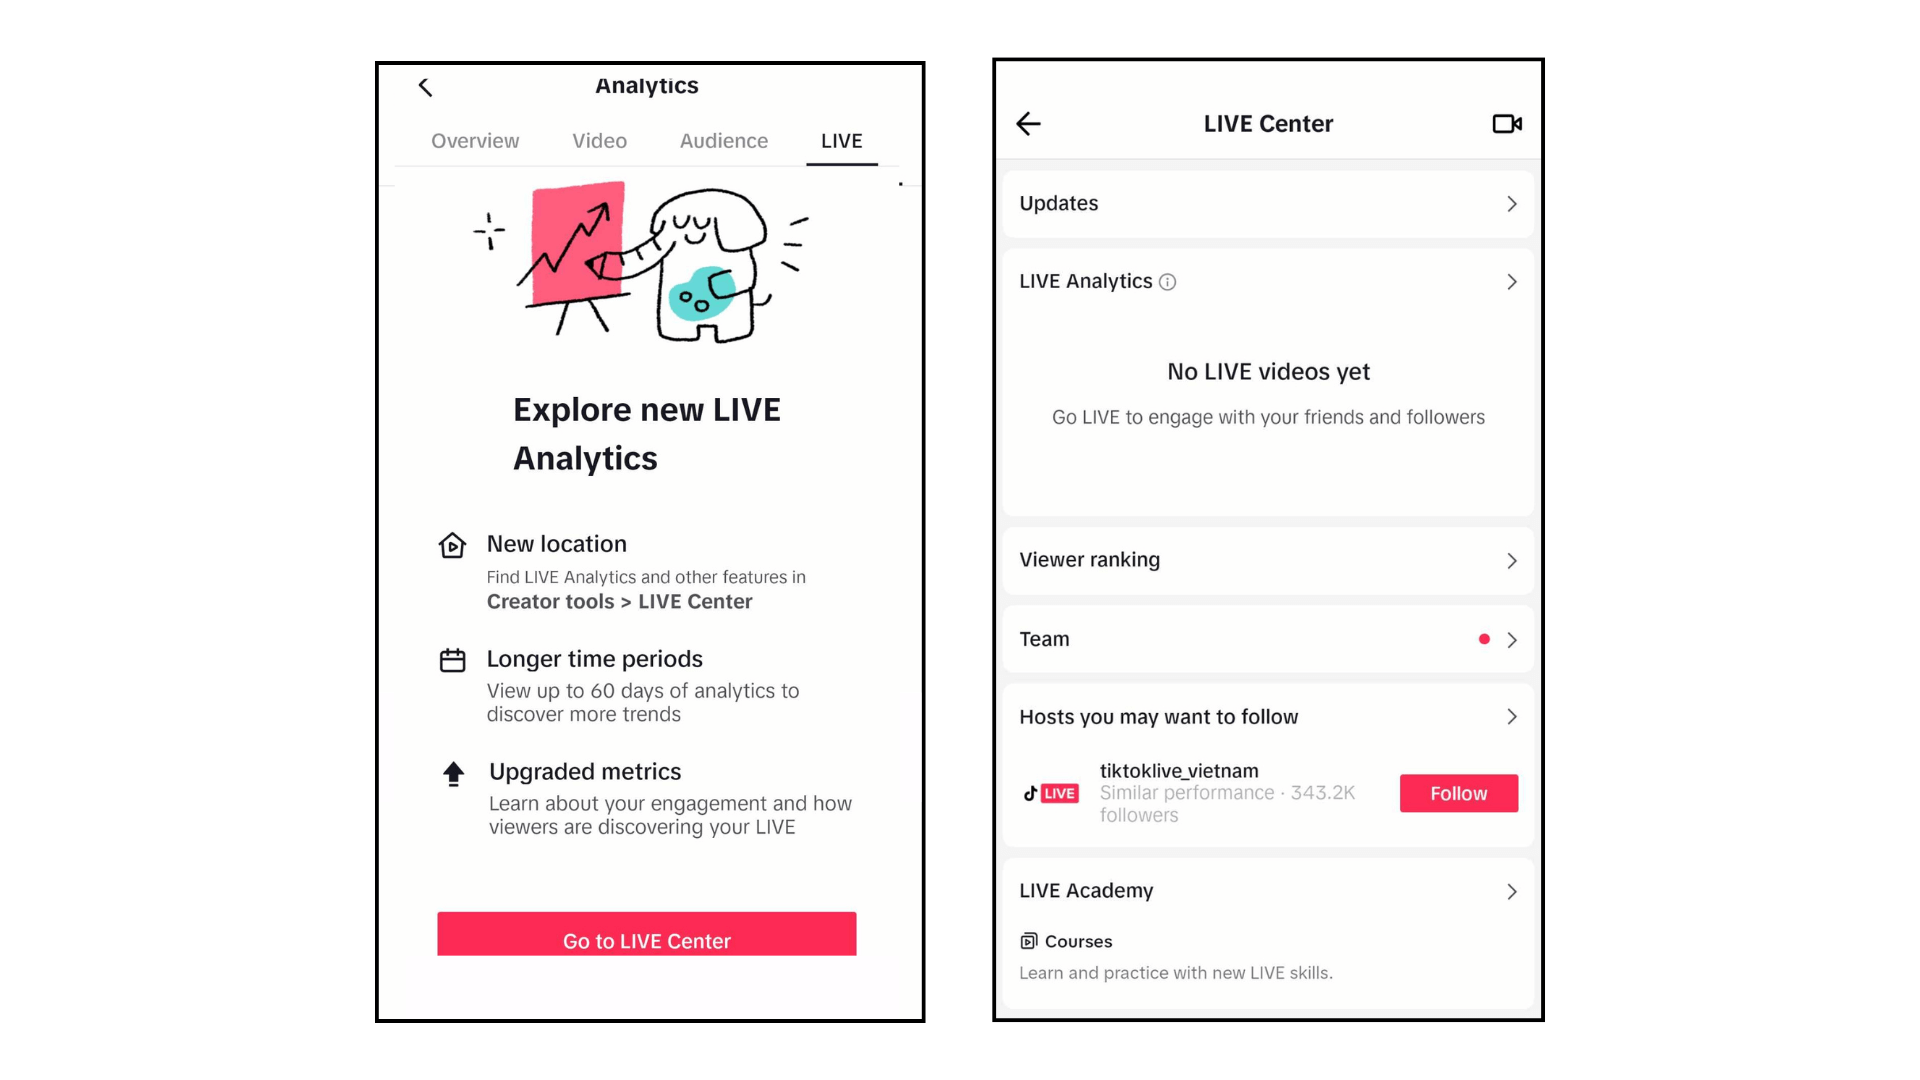
In the latest TikTok analytics update, the TikTok LIVE page will no longer display the metrics for your Live videos. Instead, when you tap on this page, TikTok will redirect you to its LIVE Center, where you can manage all your livestream activities.
This update also follow with some greater benefits. You will be able to view analytics for a longer time periods (Up to 60 days). Moreover, you will receive more upgraded metrics, which allows you to learn more about your engagement and how viewers are discovering you through live video.
Other aspects for better analysis
Alongside TikTok’s analytics, you can gather insights from additional sources within the platform. By combining these with TikTok analytics, you’ll gain a deeper understanding of what works best for your business on TikTok. So, without further ado, let’s explore these valuable sources:
Hashtag views
This metric provides the total number of views for a hashtag. It’s calculated by adding up all the views from posts using that hashtag. Looking into the Hashtag views is highly effective if you’re looking for the most efficient hashtags in your industry to include in your videos for better reach.
To view the hashtag views, visit your Business Suite > Creative Hub, and select Hashtag. Here, you’ll find a list of the most popular hashtags in your industry, ranked from highest to lowest total hashtag views. If you want the precise view count, simply click on the hashtag you’re interested in.
Total likes
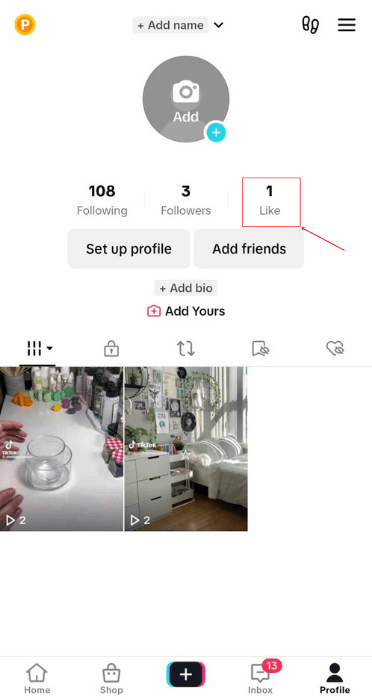
This is the total number of likes you’ve received on all your published videos. It’s a metric displayed on TikTok Analytics within the Overview page, but you can also check it directly on your profile. This is a quick way to gauge the effectiveness of your videos and see if they’re appealing to your audience.
Engagement rate
After gathering all the engagement data, including likes, comments, and shares, it’s essential to calculate the engagement rate. This helps determine if your current performance is satisfactory or not.
As TikTok Analytics provides 3 metrics to measure your video engagement, we recommend you use this formular to calculate your engagement rate:
Engagement rate = (Number of likes + Comments + Shares)/Number of followers * 100
Best practice for TikTok Analytics
Everyone may know what TikTok Analytics is, but not everyone knows how to use it to their advantage. We have gathered some valuable practices to help you become a TikTok Analytics master in no time!
Pay attention to the metrics that count
When tracking performance on TikTok, many businesses tend to focus too much on the number of views and followers. However, these metrics are not very helpful in making decisions, as they’re simply a reflection of the efforts made to increase engagement.
Because TikTok is a video-based app, it’s crucial to consistently work on boosting engagement so that your video appears on the “For You” page. Therefore, engagement metrics such as likes, comments, saves, and shares provide a more accurate way to measure the success of your TikTok efforts. Additionally, audience insights can help you assess the relevance of your content and create more content that caters to your audience’s interests.
Interpret your data correctly
Again, because TikTok has a secretive For You page algorithm, it’s certain that you will get different results every time you post a video. So, instead of getting frustrated by the fluctuation, you should focus on the bigger picture and utilize analytics as insight and sources of feedback.
Let’s take an example from a famous TikTok baker creator, @laracakesofficial, to understand better:
At first glance, it might seem like the videos are identical (They are all videos about the character Dobby from Harry Potter). Therefore, they should have performed similarly. However, only one video makes it viral with 2,3M views, while the other two stop at around 115K – 135K views.
By diving into the analytics, you can start to uncover some potential reasons for this situation:
- Retention rate: One reason can be that the retention rates for the second and third video were lower than the first video. This could indicate that viewers lost interest in the content early, resulting in lower engagement numbers.
- View rates: If the “For You” view rate for the second video is lower than the first video, it could indicate that the TikTok algorithm didn’t find the video as relevant or interesting for a wider audience, resulting in less overall engagement.
- Time posted: One more reason leads to this reason might be that the first video was posted during a more relevant timeframe, while the second video was posted during a less optimal time.
Test around to see what works best
- Try out different video formats: TikTok offers a variety of video formats, such as duets, reactions, and challenges. Hence, it would be a waste if you just focus all of your resources on one type. We recommend you experiment with different formats and see which ones resonate with your audience.
- Test out different posting times: If you notice that your videos perform better at certain times of day or days of the week, try posting more consistently during those times.
- Experiment with different audio: TikTok is known for its viral audio trends, so try using different audio tracks to see if it boosts engagement. You can also create your own original sound bites and see how they perform.
- Try out different hashtags: Hashtags help users discover your content on TikTok, so experimenting with different tags can increase your visibility. Hence, you should make use of relevant and popular hashtags to reach a wider audience.
Frequently Asked Questions (FAQs)
How do I turn on TikTok Analytics for my business?
Switch to a Business Account via Settings and Privacy > Account > Switch to Business Account on mobile, or toggle the Business Account option on desktop. This unlocks TikTok Business Suite Analytics for deeper insights.
Can I check TikTok Analytics for other users?
Yes, but only for public accounts, and insights are limited compared to your own account. Use TikTok Analytics Viewer or third-party tools for competitive analysis.
What is the best TikTok Analytics tool?
TikTok Business Suite Analytics is the most convenient and robust tool to track reach, engagement, and conversions of your videos.
Besides, if you’re running ads for your Shopify store, you can also use tracking & real-time analytics tools like NS TikTok Pixel to track user actions after they land on your store. Thereby, you can optimize ad campaigns more effectively based on data-driven insights.
How can I optimize my TikTok posting times?
Use TikTok audience insights to identify when your audience is most active. Test different posting times and analyze engagement rates to find the best schedule.
How do I calculate my TikTok engagement rate?
Use the formula: Engagement Rate = (Likes + Comments + Shares) / Followers * 100. This helps measure content effectiveness and guide your TikTok content strategy.


