


To enhance the effectiveness of your Facebook ads, it’s essential to grasp the information provided by Facebook. This understanding will shed light on your ad’s performance, expenditure, and the key performance indicators (KPIs) crucial for achieving better outcomes. While the data available in your ads manager account may be overwhelming, clarity can be achieved by establishing precise ad metrics on Facebook. This ensures that your data becomes a valuable and comprehensible tool.
In this blog, we’ll walk you through eight key metrics that offer insights into your ad’s performance, enabling you to generate genuine leads that have a direct impact on your sales. So, prepare to uncover how these metrics can be utilized to optimize your Facebook ads.
What are Facebook Ad metrics & KPIs?
Facebook ad metrics & KPIs are specific data points that show how well your ads are doing on the platform. They provide insights into various aspects of your ad campaign, such as the number of people who viewed your ad, clicked on it, or took a desired action like making a purchase.
By analyzing these numbers, you can identify what’s working effectively and what needs improvement in your campaigns. They act as a guide, helping you navigate the digital advertising landscape and make informed decisions to enhance your ad strategies & maximize your return on investment.
What are the most important Facebook Ad metrics & KPIs?
In your Meta Ads Manager account, there are 4 primary sets of metrics available, each falling under specific categories: Performance, Engagement, Conversions, and Settings metrics. However, we only need to focus on 3 categories, including:
| Performance metrics | Engagement metrics | Conversion metrics |
| – Results – Cost per mile – Cost per result – Frequency | – Click-through rate – Post engagement | – ROAS – Conversion rate |
Performance metrics
To understand how your Facebook ads are performing, advertisers need to concentrate on the basic metrics that assess overall ad performance. This mainly involves figuring out how often your ads are shown to the audience, without going into deeper interactions.
These metrics are particularly useful when you’re running a Facebook campaign to raise brand awareness among your audience. Now, let’s delve into some metrics that can offer general insights into how well your ads are performing:
Ads results
Firstly, you can easily gauge how well your ads are doing without doing any calculations by checking the results they generate. In terms of performance, Facebook will provide you with three fundamental metrics in the Meta ads reporting, which are:
- Reach: This metric signifies the number of individuals who have viewed your ads at least once.
- Impression: It measures the frequency with which an ad appears on the screen for the audience.
- Delivery: This metric goes beyond mere exposure and delves into the specifics of audience interaction. It includes general information about your audience, such as their age, gender, location (country and region), platform usage, and the time of day when they are most active. Understanding delivery helps you identify who is engaging with your ads the most.
CPM (Cost per mile)
CPM or Cost Per Mille, is a metric that represents the cost incurred for 1,000 impressions of your Facebook ads. It’s calculated by dividing the ad spend by the number of impressions and multiplying by 1,000. For example, if your total ad spend is $100 for 15,000 impressions, then your CPM will be (100/15,000)*1000=$6.67.
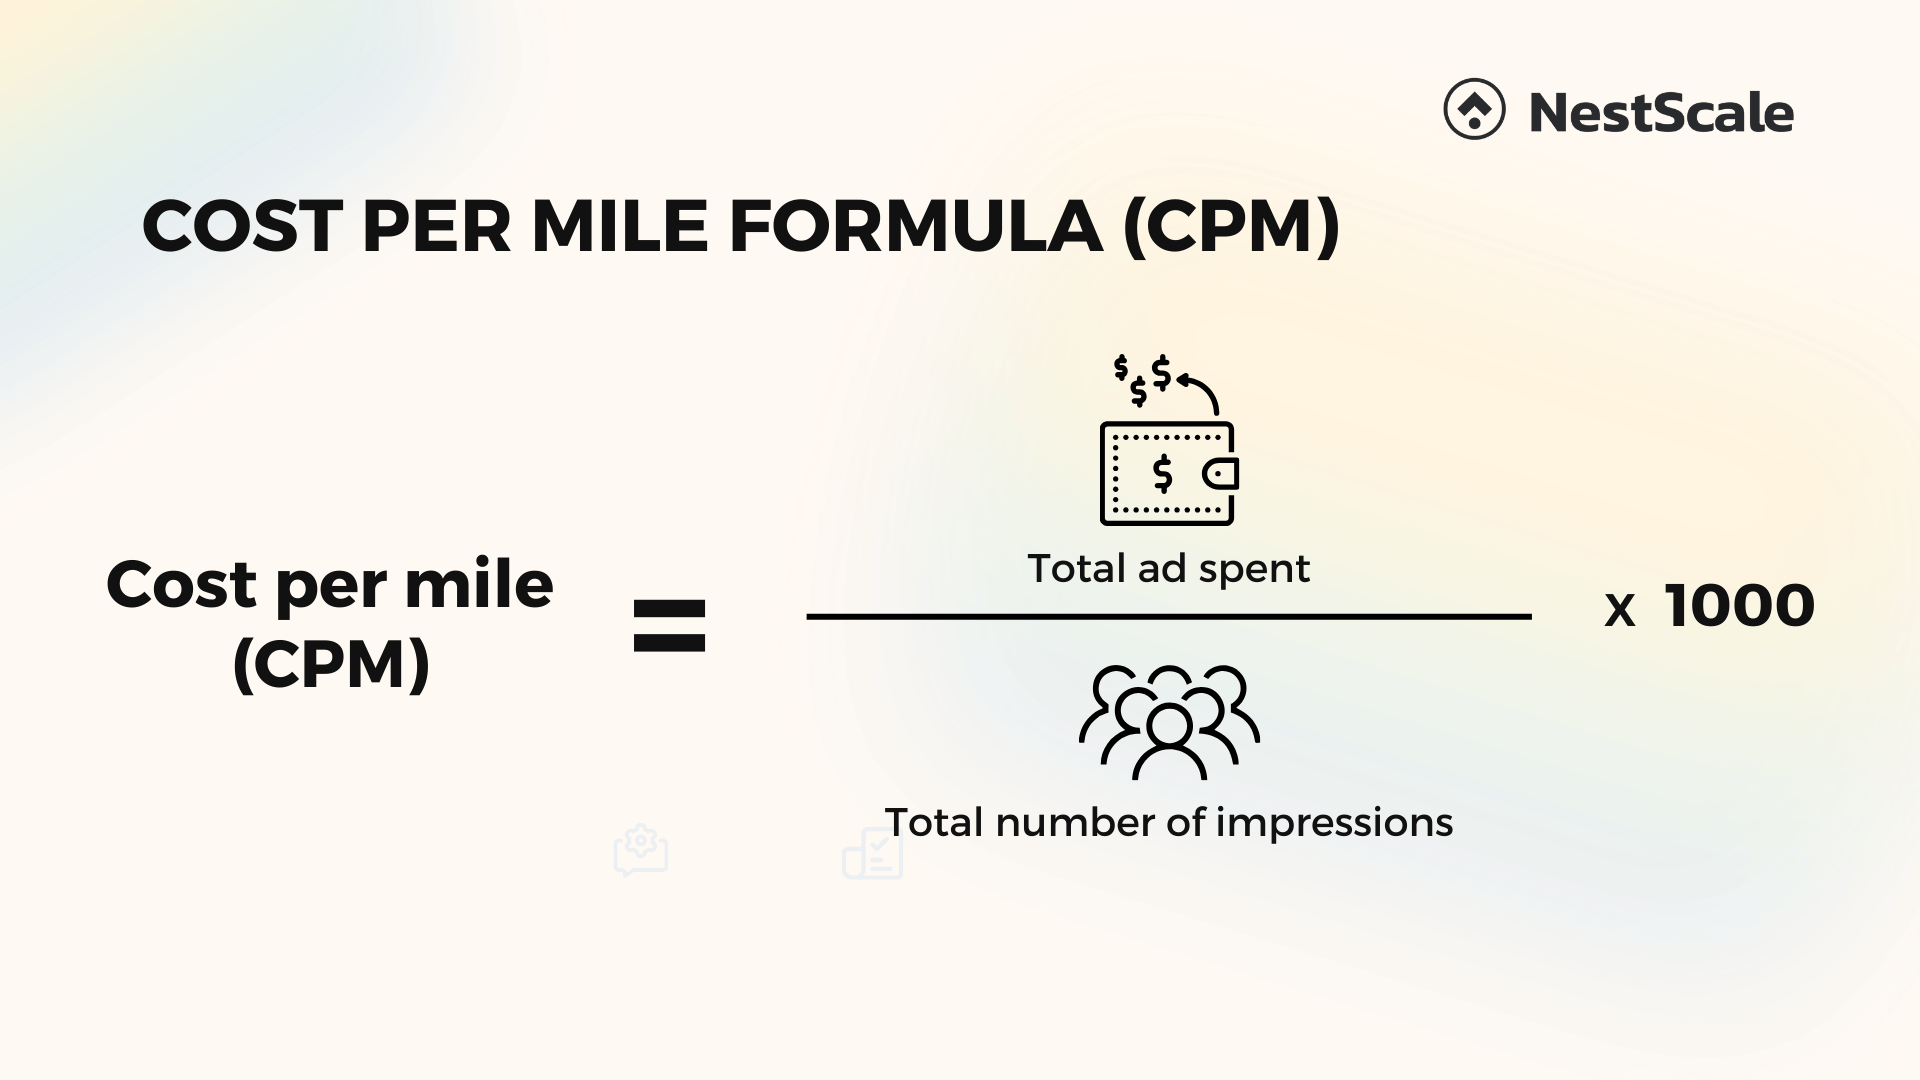
CPM is beneficial as it provides insights into the efficiency of an ad campaign, which helps you understand the cost-effectiveness of reaching your target audience. You can also use this metric to measure the relative cost of ad exposure and compare it across campaigns. For example, if your current campaign has a higher CPM than the previous one, it might indicate increased competition for your target audience or that your ads are not performing as well.
CPR (Cost per result)
Cost per Result (CPR) in Facebook ads refers to the average cost incurred for a specific action you aim to achieve through your ad campaigns, such as leads or video views. To calculate CPR, divide the total amount spent on the campaign by the total number of desired results obtained. For example, if you spent $500 and obtained 100 leads, your CPR for lead generation would be $5 ($500/100=$5.00 per lead).
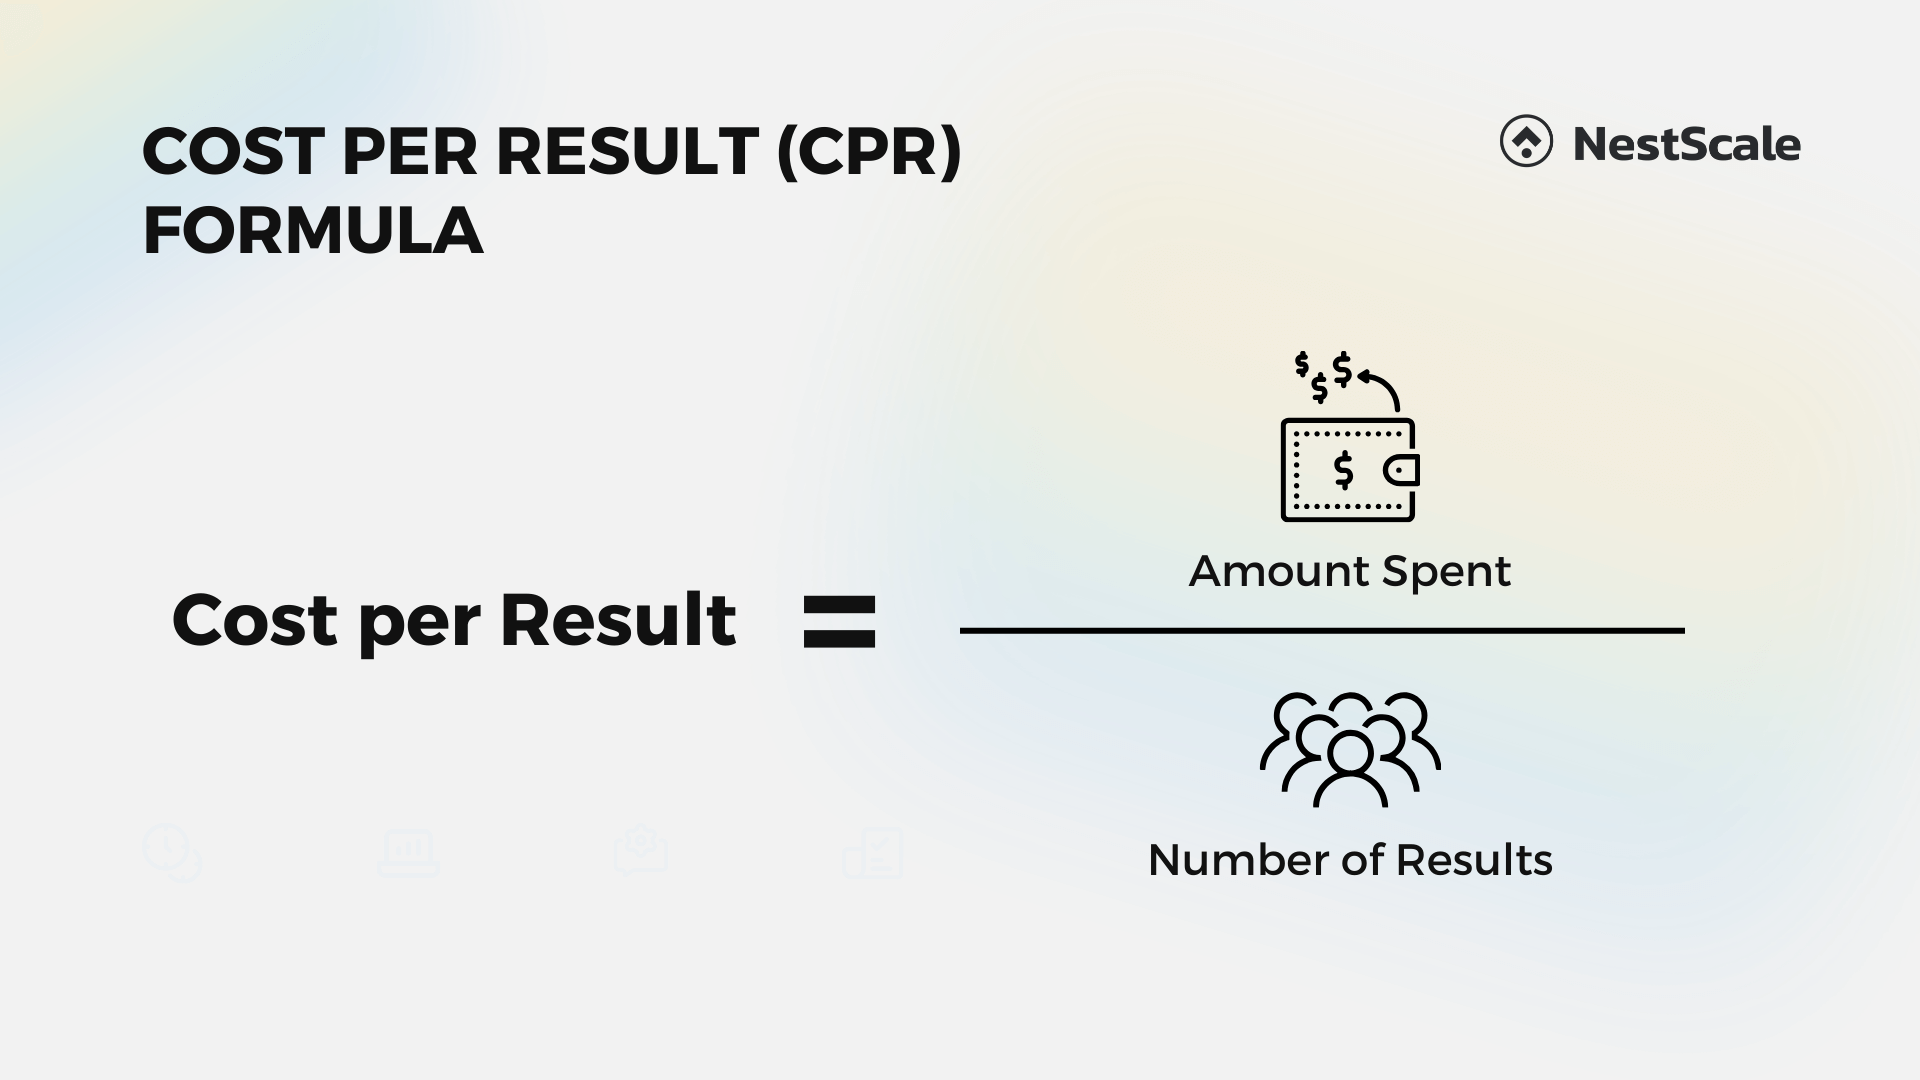
It helps identify which audience or creative elements yield the best results at the lowest cost. Analyzing CPR allows you to optimize your ads, focusing on strategies that work effectively, and eliminating less productive ones. This data is vital for making well-informed decisions and ensures that your ad spending aligns with your goals and budget.
What is a good CPR for Facebook ads?
The cost per lead can fluctuate significantly, reaching highs of $153.48 during peak advertising seasons. On average, it hovers around $81. Knowing these benchmarks aids in effective budget allocation, enabling you to achieve desired results within your budget limits.
Frequency
Frequency refers to the average number of times a unique user sees your ad over a specific time period. It is a key metric that helps advertisers understand how often their target audience is exposed to the ad content. For example, if an ad has a frequency of 2, it means that, on average, each user has seen the ad twice.
Monitoring frequency is important because it can impact the effectiveness of an ad campaign. Too low a frequency might result in limited exposure, while too high a frequency can lead to ad fatigue, where users become disengaged or annoyed by seeing the same ad too frequently. You should aim to find a balance in frequency to maximize reach and engagement without overwhelming the audience.
Engagement metrics
Performance metrics quantify the reach of your ads, measuring how many people they’ve reached. On the other hand, engagement metrics assess the quality of your ads, considering factors like interaction and the duration of audience engagement. Let’s delve into specific engagement metrics that offer valuable insights when analyzing your ads:
Click-through rate (CTR)
Click-Through Rate (CTR) is a specific metric in Facebook advertising that measures the effectiveness of your ads in driving users away from Facebook to visit your external website. Unlike the standard click-through rate, which counts clicks regardless of the destination, outbound clicks are specifically tracked when users leave Facebook’s platform to engage with your website. The formula for Outbound CTR is as follows:
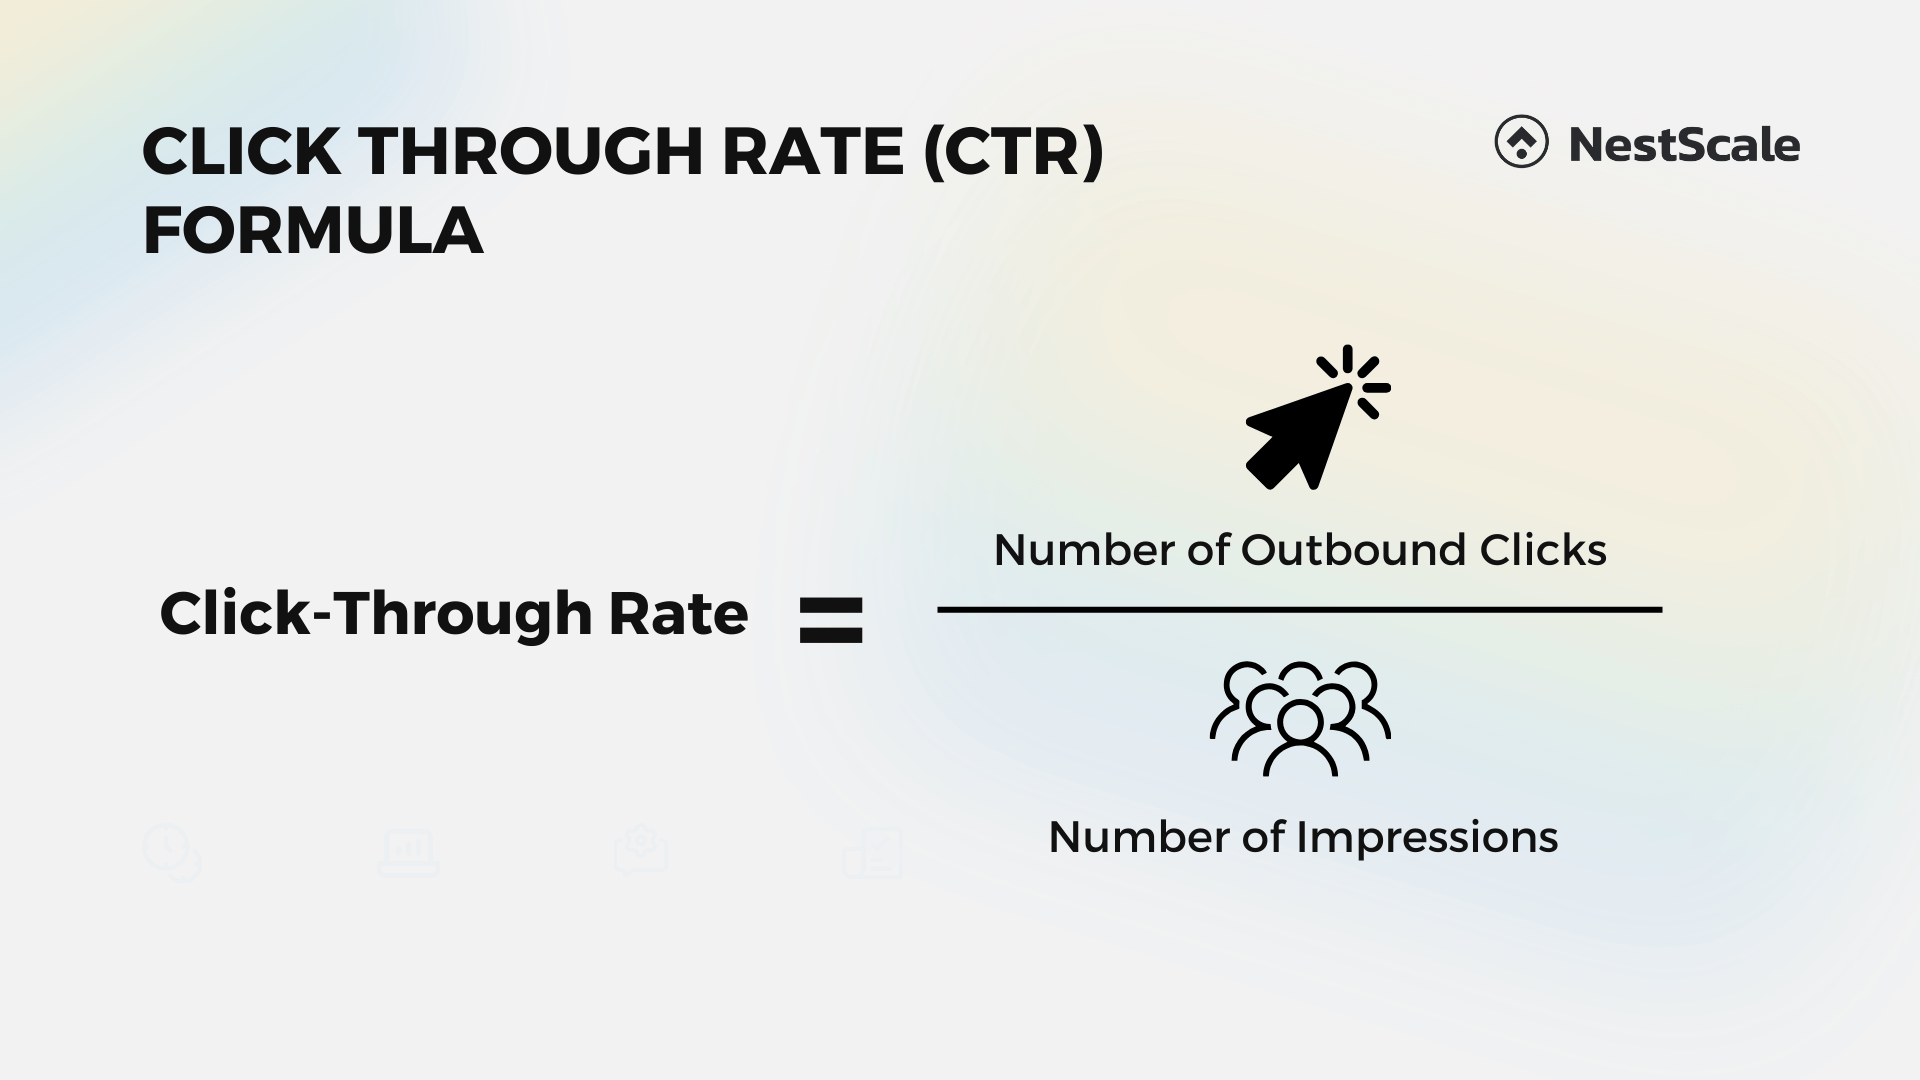
For example, if your ad received 1,000 impressions and 10 people clicked on the ad to visit your website, your Outbound CTR would be 1%.
CTR helps you determine which ad creatives capture the interest of your audience the most. By analyzing this metric, you can refine your ad content to better convey the value of your offering. A high CTR suggests that your audience finds your product or service relevant. Conversely, a low CTR may indicate a mismatch between your ad message and the audience’s needs.
What is a good CTR for Facebook ads?
An optimal click-through rate (CTR) for Facebook ads typically falls within the range of 0.5% to 5%. Nevertheless, the CTR is subject to fluctuations influenced by various factors such as your industry, target audience, ad type, and campaign objective. Therefore, we suggest you set a benchmark first so that you can assess your results later on.
Engagement rate
Engagement rate represents the percentage of people who actively interact with your ad, including actions like likes, clicks, shares, and comments. It’s a measure of how effectively your ad is capturing and maintaining audience interest on social media platforms. While Click-Through Rate (CTR) focuses on the number of clicks, Engagement rate provides a more holistic view by considering various interactions and social proof. Positive social proof can influence potential customers positively.
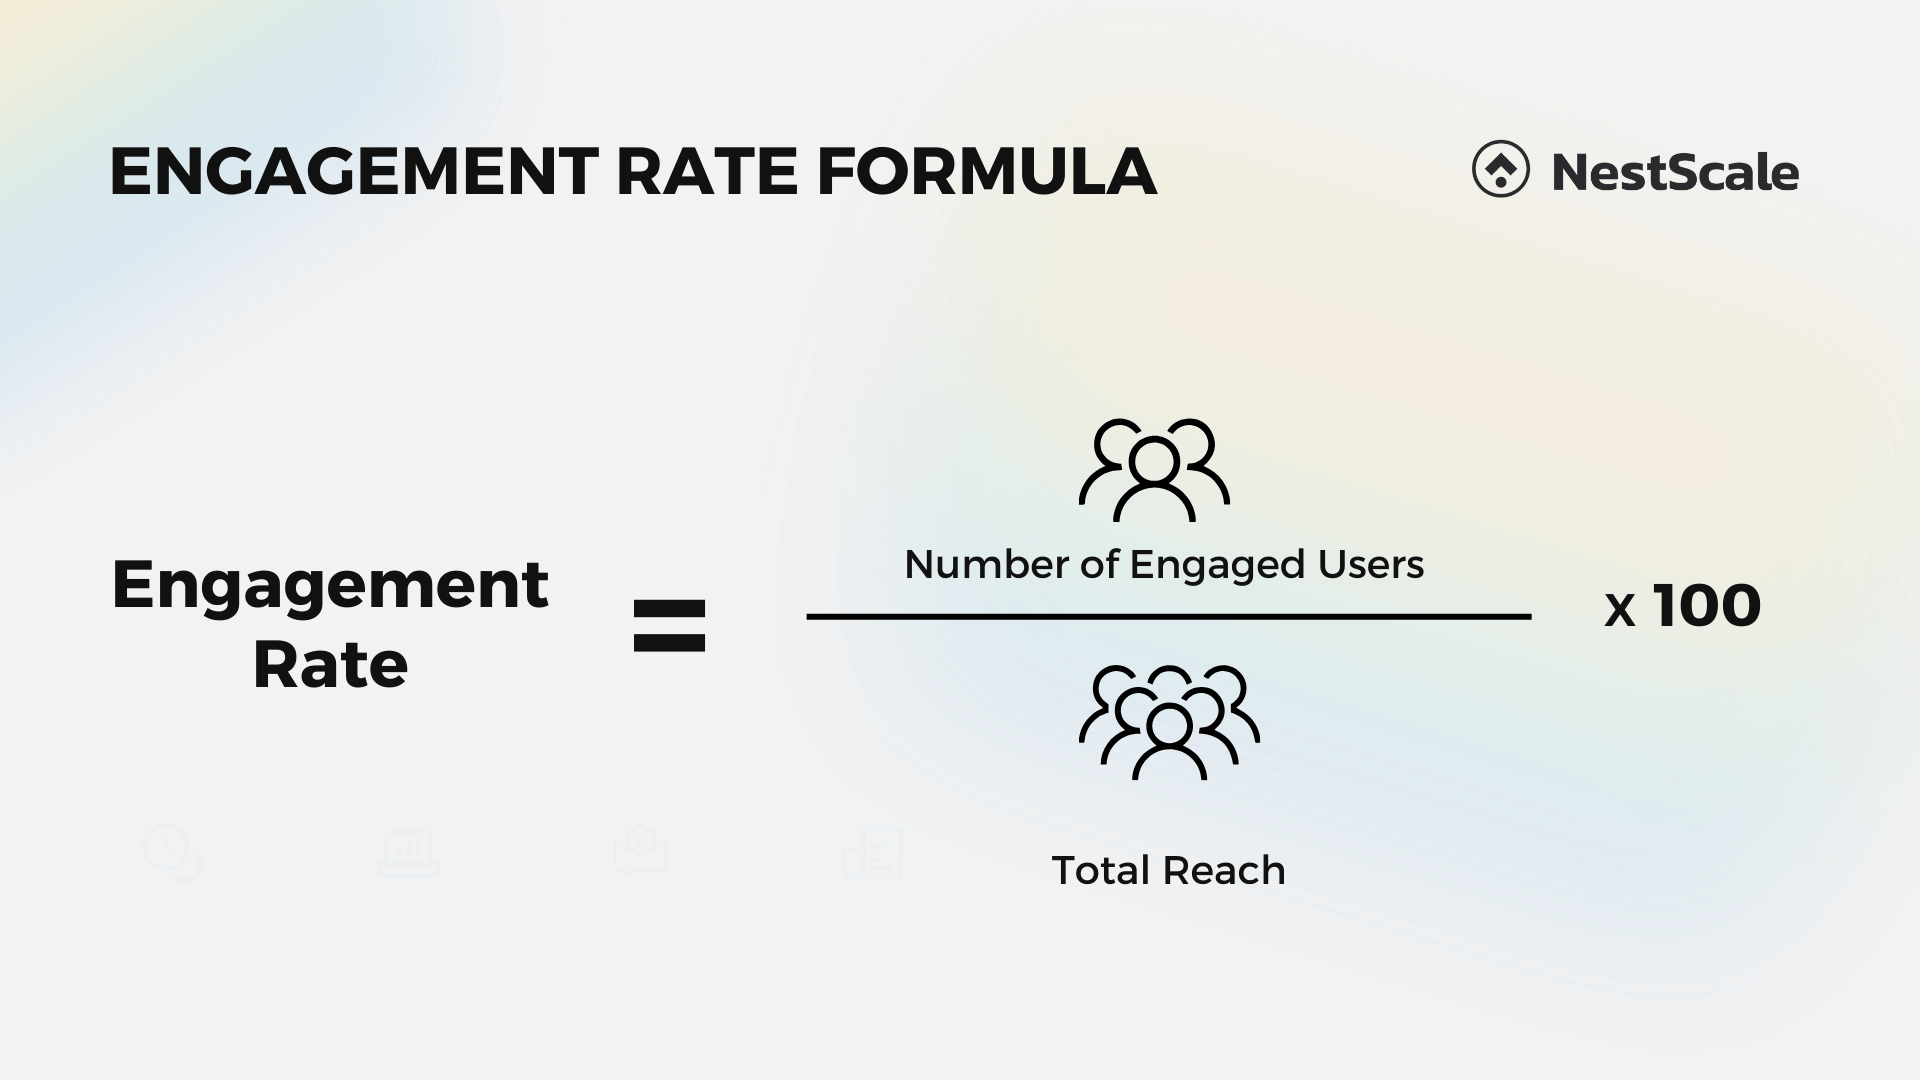
Engagement rate helps you gauge the genuine interest of your audience in your ad content. A higher engagement rate indicates that your ad resonates well with viewers, encouraging them to interact with it in meaningful ways. Moreover, these interactions extend your ad’s reach beyond your immediate audience, potentially attracting new customers and increasing brand visibility.
Conversions metrics
Lastly, the conversion metrics refer to the measurements that track and analyze the actions users take after clicking on or interacting with an ad. These metrics provide insights into how effective an ad is at encouraging desired actions that can help you boost your business’s results. Meta Ads Manager now allows you to track some of the conversion actions such as Add to cart, Add payment info, and Donations.
Let’s explore some metrics that will be highly valuable for tracking and measuring the conversion of these actions:
Conversion rate
The conversion rate in online advertising, including Facebook ads, is a crucial metric that indicates the percentage of people who clicked on your ad and then took the desired action, such as making a purchase or signing up for a newsletter. To calculate the conversion rate, you use the following formula:
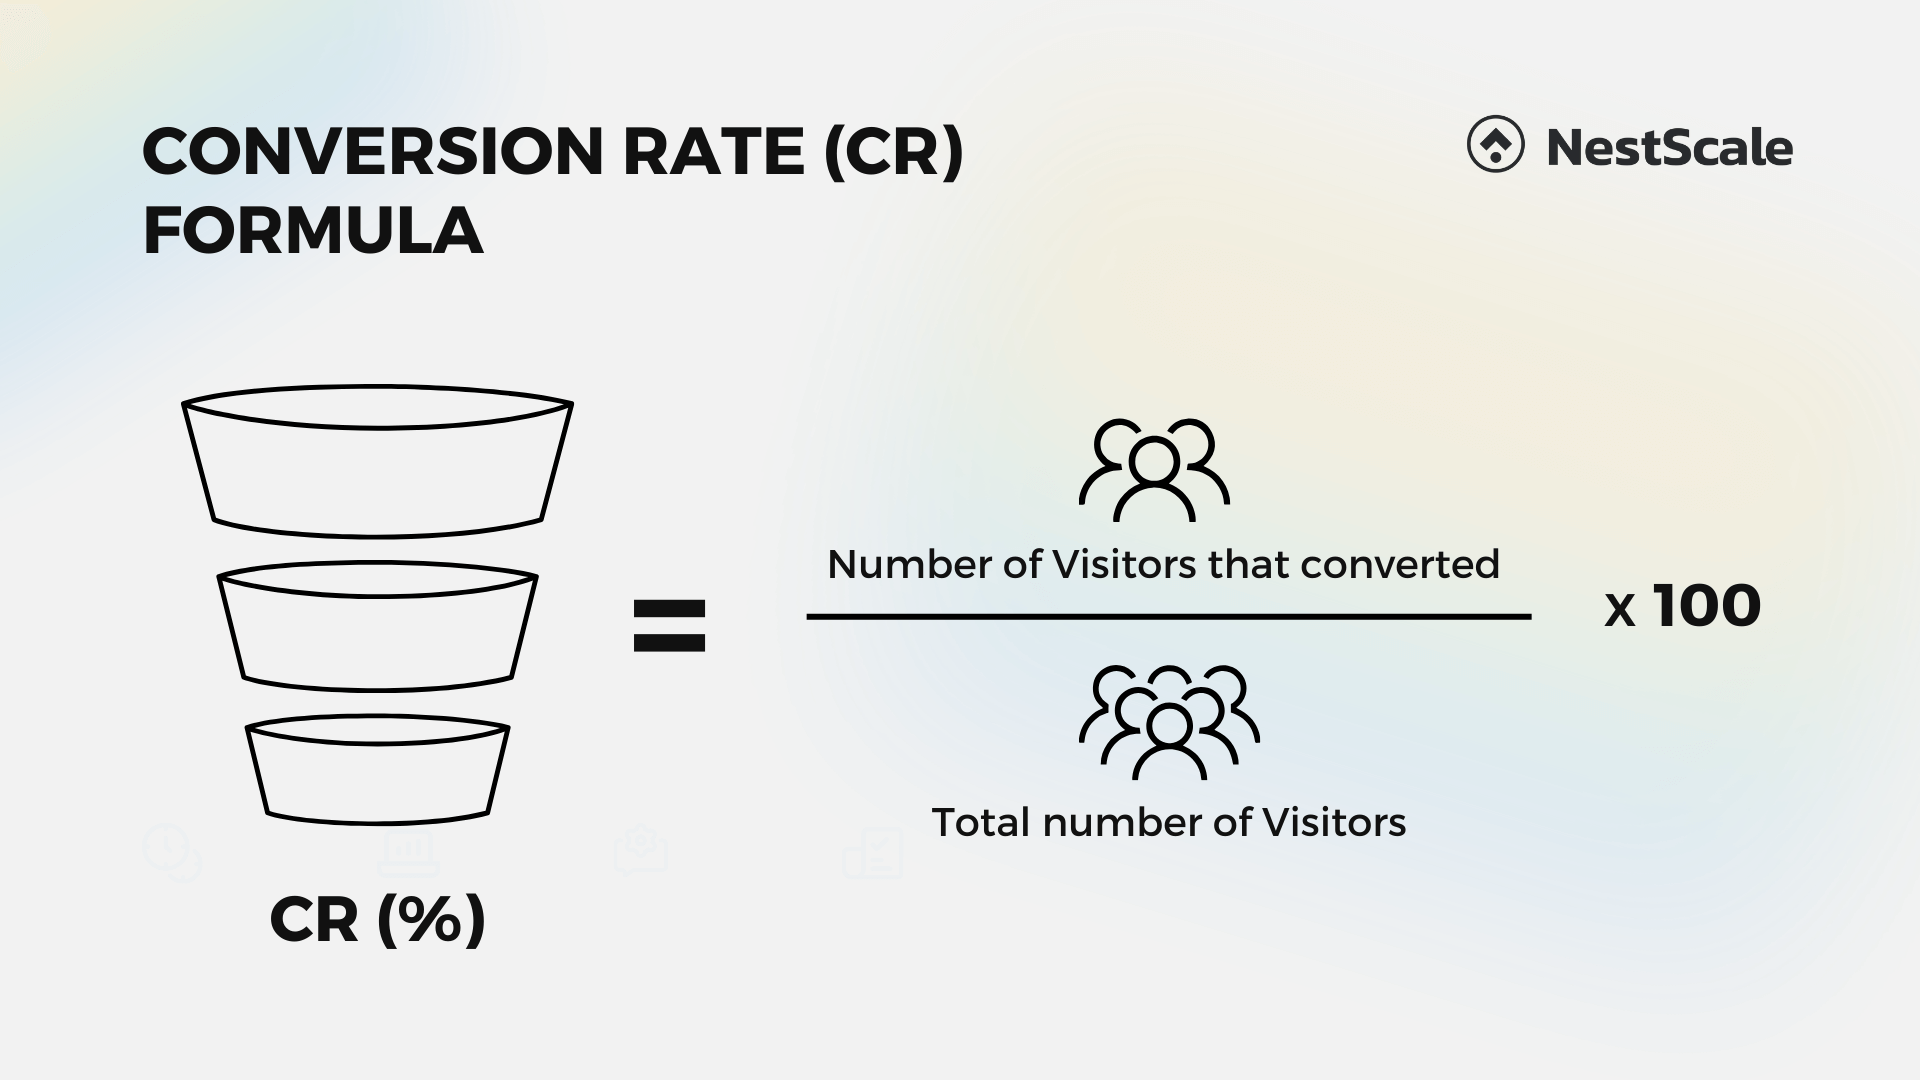
For example, if 100 people clicked on your ad and 10 of them made a purchase, your conversion rate would be 10%.
A high conversion rate indicates that your ad content and targeting are resonating well with your audience, leading to more desirable actions being taken. Understanding your conversion rate can reveal where potential customers drop off in your sales or conversion funnel. Identifying these points enables you to optimize those specific stages, which eventually improves your overall conversion rate.
Return on ad spend (ROAS)
Return on Ad Spend (ROAS) evaluates the revenue generated in comparison to the cost incurred for the advertising campaign. A high ROAS suggests that your ad campaigns are delivering strong returns on investment, indicating success from a revenue standpoint. By analyzing ROAS, you can identify which campaigns are generating the most revenue per dollar spent, allowing you to allocate your budget effectively, focusing on campaigns that deliver the highest returns.
To calculate ROAS, you can use the following formula:
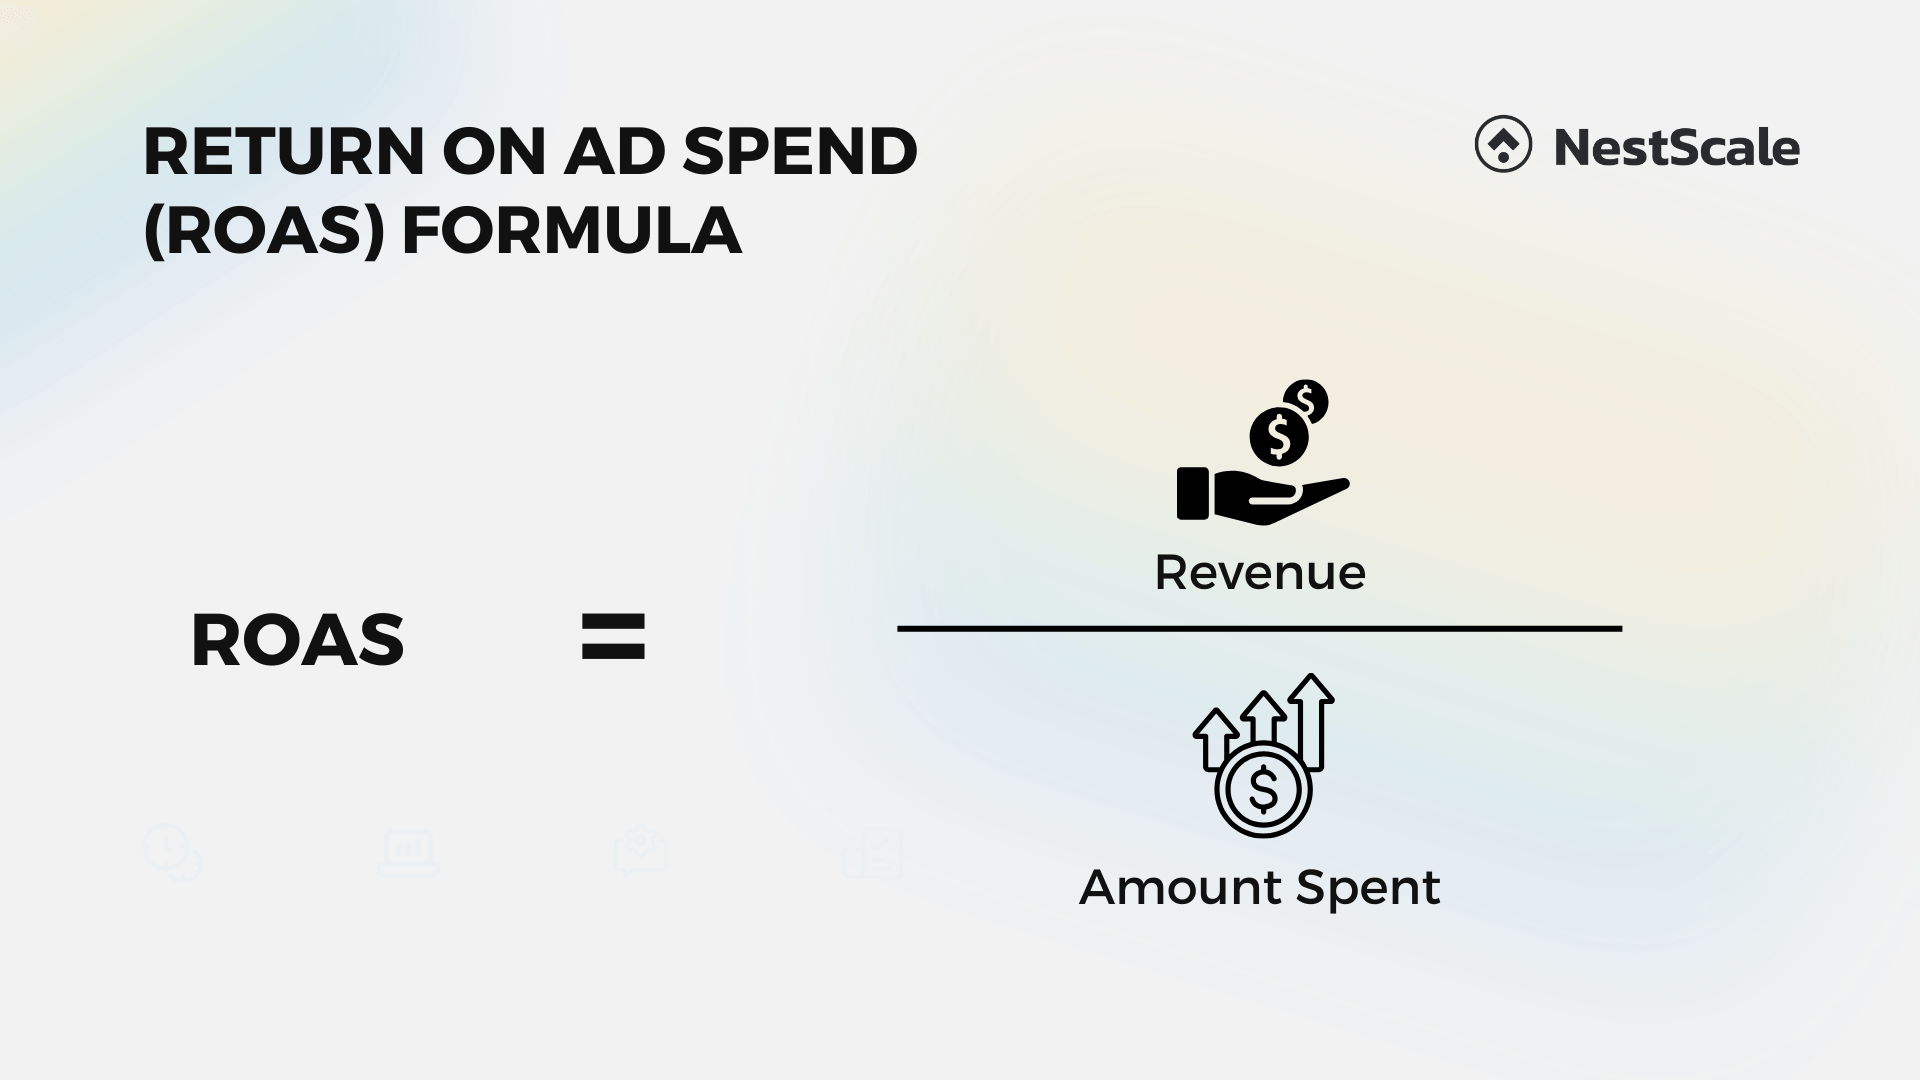
For instance, if your campaign generated $20,000 in revenue and you spent $5,000 on ads, your ROAS would be 4. This means for every $1 spent on ads, you made $4 in revenue.
What is a good ROAS for Facebook ads?
ROAS values tend to stay relatively consistent over timeframes. For instance, if your ROAS is 2, it means you are earning $2 for every dollar spent on advertising. Monitoring ROAS helps you understand the effectiveness of your campaigns and make data-driven decisions to maximize your return on investment.
To help you focus on the metrics that really matter to your business, we have recently released a new video with detailed guidelines about Facebook Ads metrics. Give it a try to make the process of monitoring and analyzing become easier!
How to track metrics in Meta Ads Manager?
In Meta Business Suite, you will find insights on the performance of each ad you run on Facebook, Instagram, or any other platform in the group. Here are the steps you need:
Step 1: Login and access Ads Manager
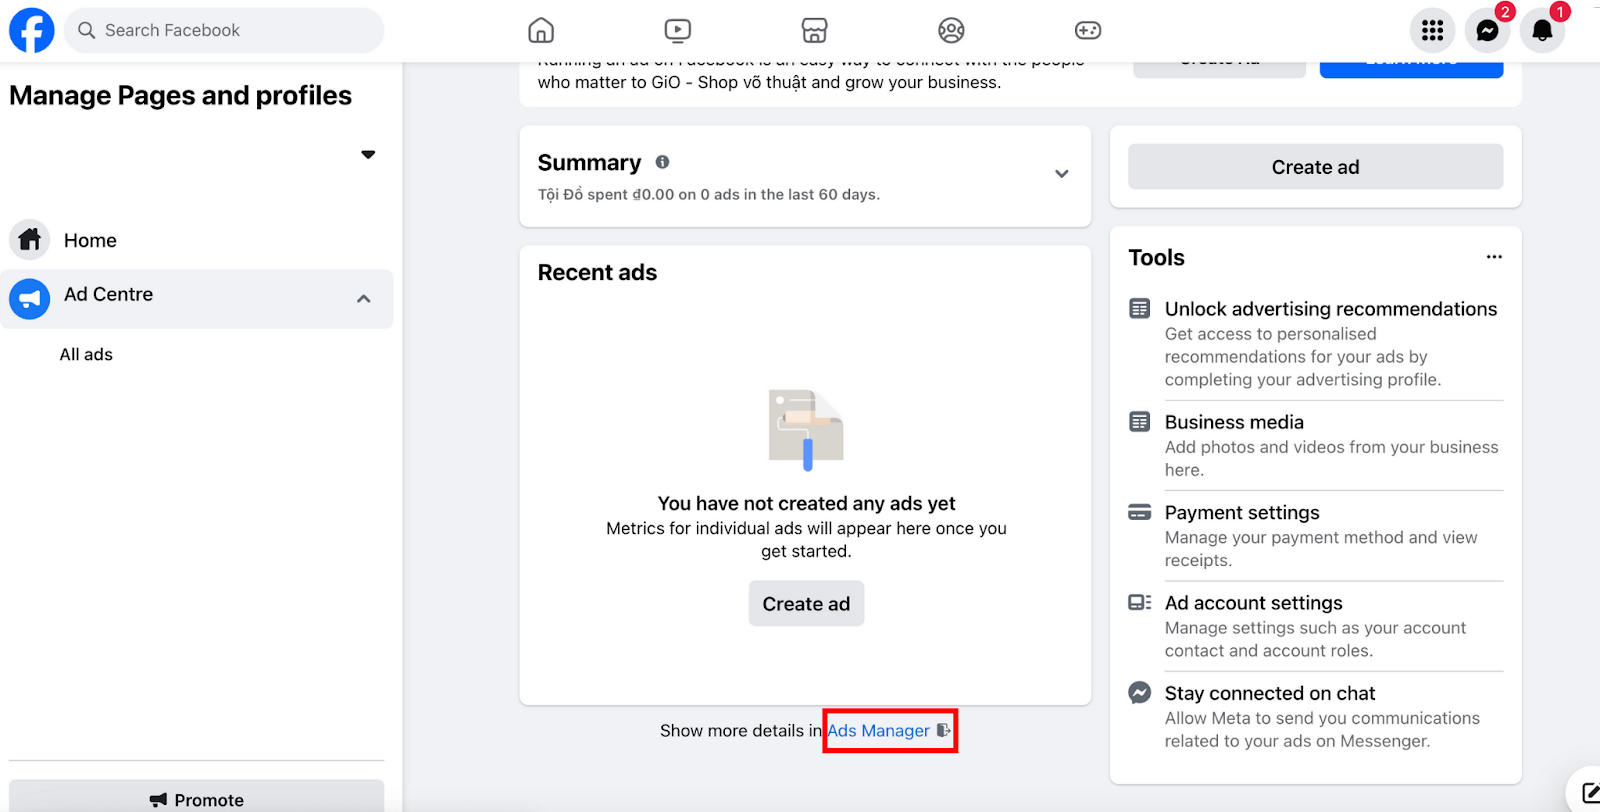
Start by logging into your Meta Business Suite account and navigating to Ads Manager. Once you’re in, look for the campaign view section.
Step 2: Review default metrics
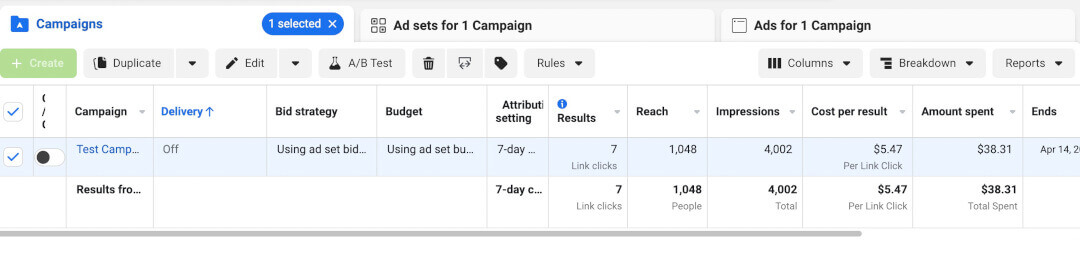
In the default view, Facebook provides essential metrics like delivery, bid strategy, budget, results, reach, impressions, CPA, amount spent, and more. These are fundamental indicators of your ad performance.
Step 3: Explore specific metrics
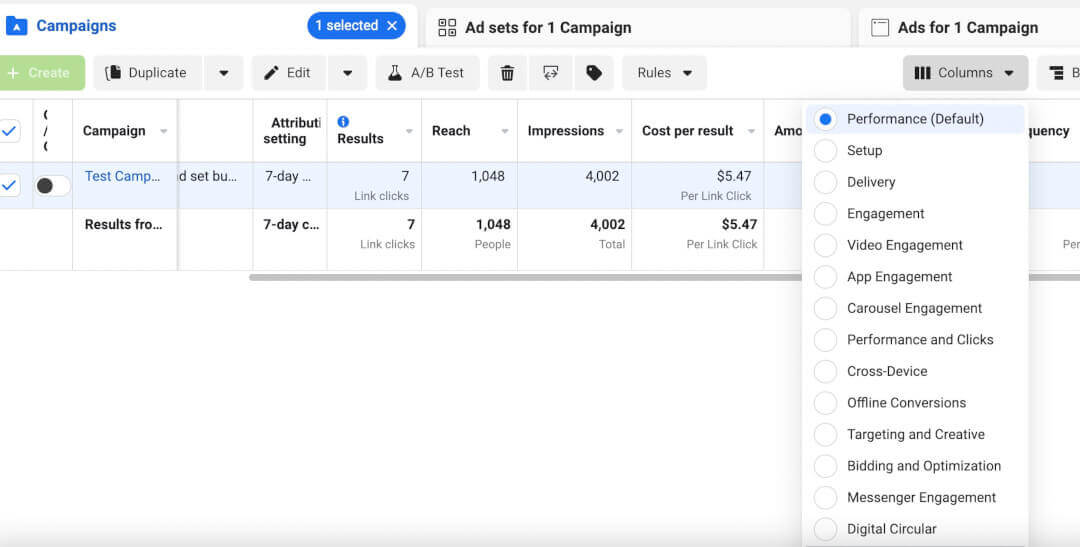
Click on the Columns link under the ads tab to access more specific metrics. For instance, the Engagement view shows likes, comments, saves, shares, and page likes. If you can’t find what you need, customize your columns by clicking Customize Columns. Here, you can create tailored metrics
Step 4: Utilize breakdown options
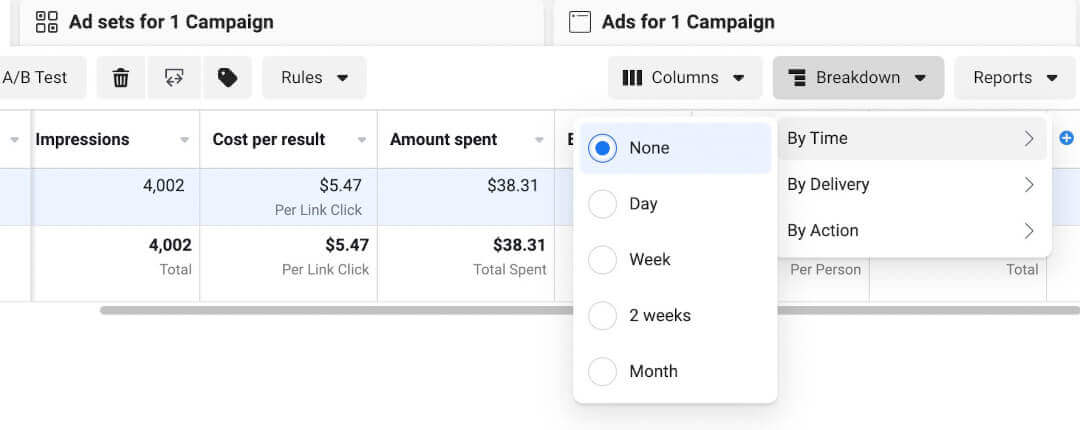
Under the breakdown tab, you can further refine your data. Choose By Time to view results daily, weekly, bi-weekly, or monthly. By Delivery lets you break down data by factors like age, gender, time of day, country, platform, and placement. By Action provides detailed insights into specific actions, such as post reactions and video views.
Step 5: Experiment and analyze
Experiment with different metrics and breakdowns. Use Delivery to assess platform engagement, compare media types, or analyze geographic performance. Tailor your metrics and breakdowns to gain a clearer understanding of your ad’s impact and audience engagement.
By following these steps and exploring various metrics, you can effectively track your Facebook ad performance and make informed decisions to optimize your campaigns. to match your specific goals.
Is there a better way to track Facebook ad metrics?
We’ve just taken you through the ins and outs of Facebook Ad Metrics, from understanding what they are to mastering the art of tracking them.
However, in the world of Facebook Ads Manager, there are hurdles to leap. Facebook’s short 7 to 14-day attribution window and the complexity of evolving privacy rules have created challenges for marketers. But fear not, NestAds has your back.
Unlike Facebook Ads Manager, NestAds breaks these barriers. Our NestAds pixel relies on first-party data, ensuring accuracy and privacy compliance without relying on third-party platforms. Plus, we offer a flexible attribution window, spanning from 7 to 90 days. This extended timeframe empowers businesses to dig deep into historical data, understanding performance trends comprehensively. NestAds simplifies data management by consolidating raw performance data from various channels into one intuitive dashboard. No more hassle of switching tabs! Dive into NestAds and experience a world where limitations are simply stepping stones to success.