


To grow your Shopify store, you need to understand how visitors interact with your website.
Beyond rows of numbers, customer behavior analysis tools show you how it is happening.
In this article, I evaluated the top options on the market by focusing on four criteria: ease of use, feature depth, Shopify integration quality, and pricing value. This guide will help you choose the best tool for your store in 2026.
1. Top 5 User Behavior Analytics Tools for Shopify
This section breaks down the top tools available for Shopify merchants. Before we look at the individual features of each app, you can use this summary table to compare prices, core features, and setup times.
| App Name | Pricing | Key Feature | Best For |
| NS Revenue Heatmap & Replay | Free to use | Connect heatmaps to revenue and AOV | Merchants focusing on CRO |
| Microsoft Clarity | Free to use | Heatmaps and user session recordings | Startups |
| NestAds | Free plan available; paid from $129.99/month | Marketing ad attribution & customer journey | Brands rely on paid ad traffic |
| Lucky Orange | Free plan available; paid from $19/month | Heatmaps with real-time surveys and live chat | Stores with active customer support team |
| Glew.io | From $80 to over $600/month | Customer cohorts & LTV tracking | Merchants focusing on customer loyalty |
1.1. NS Revenue Heatmap & Replay
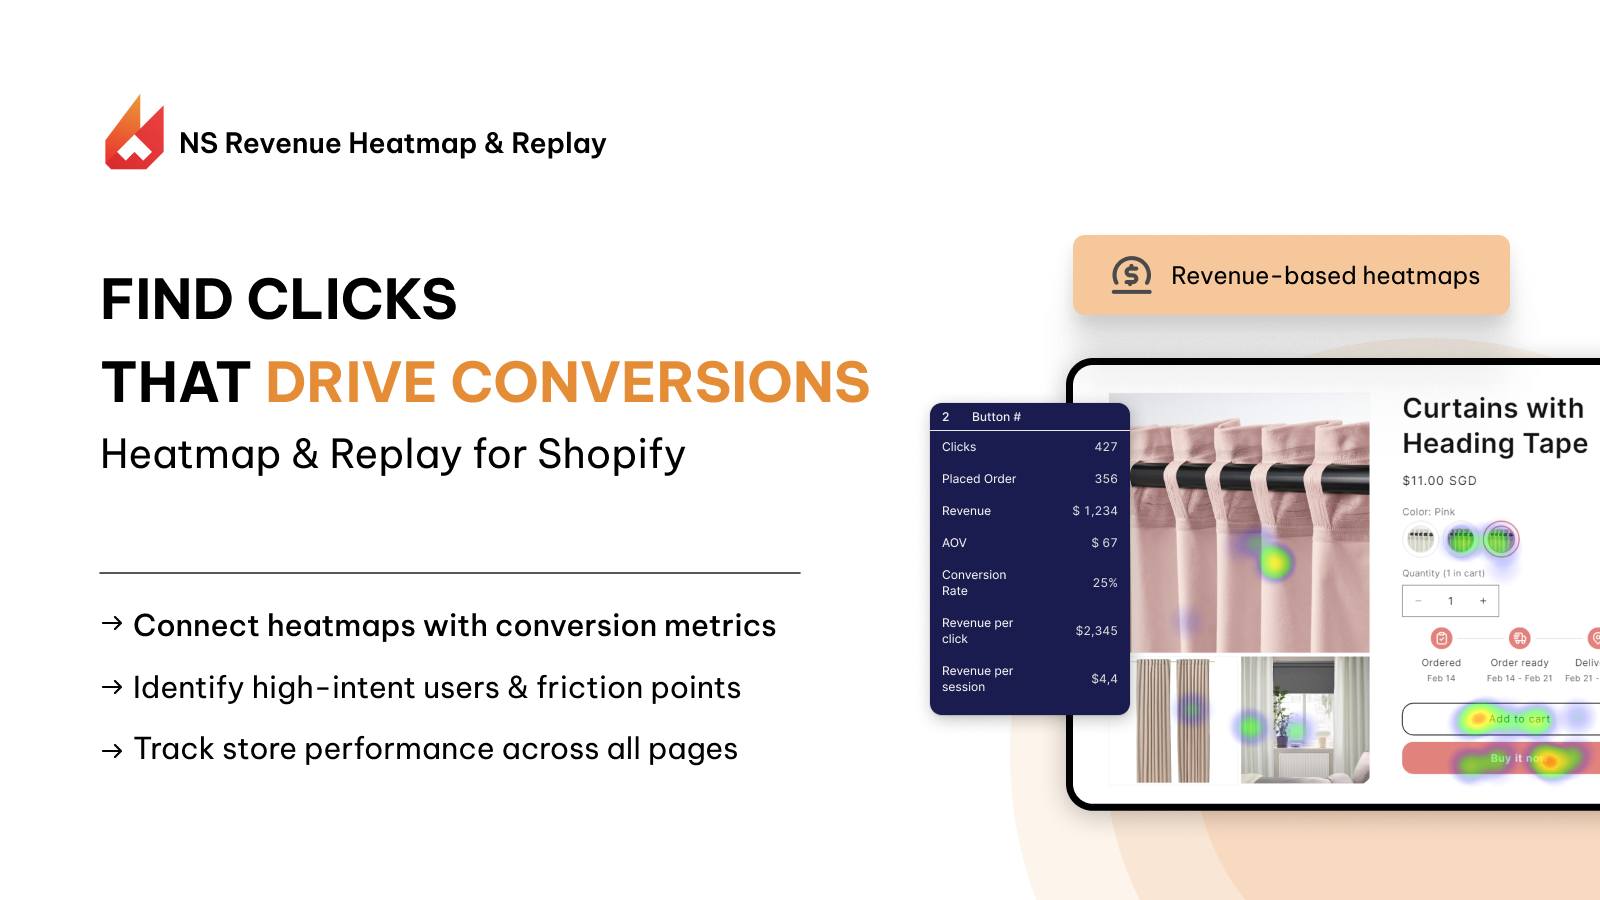
NS Revenue Heatmap & Replay is a conversion tool that links behavioral tracking directly to your sales numbers. It helps you focus on the specific user actions that bring in revenue.
Why it’s great for user behavior analysis
- Links heatmap data directly to financial metrics: Instead of only showing total click volume, its revenue-linked heatmaps show you the exact dollar amount generated by every single button and banner on your store.
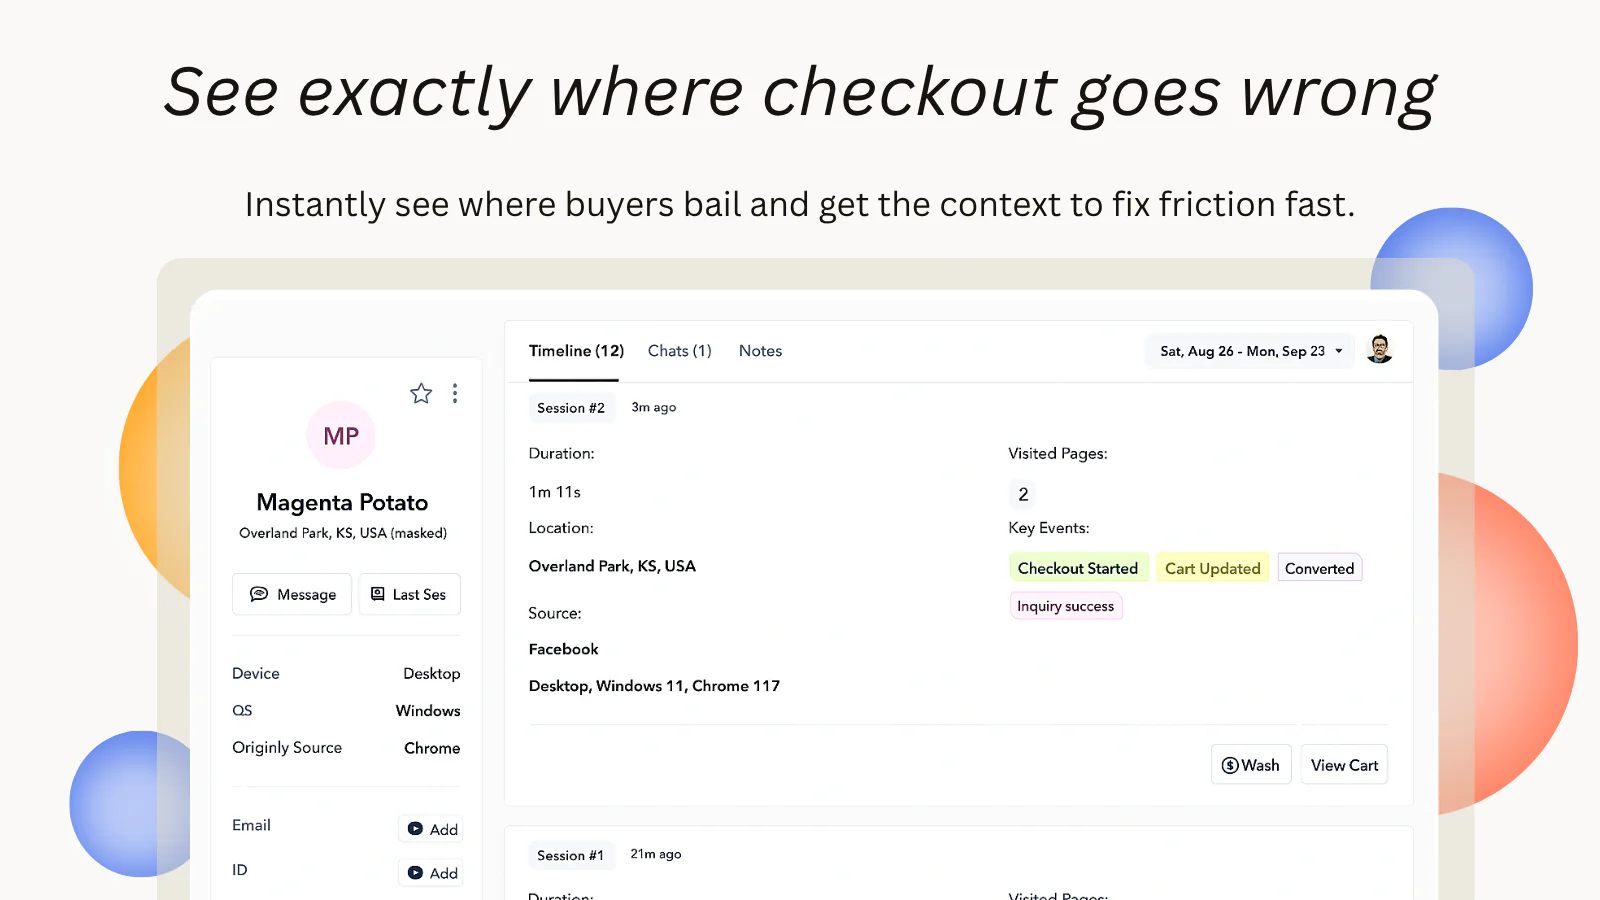
- Filters session recordings by cart value: You can isolate and watch replays of users who added high-value items to their carts but left before paying, helping you see the exact reason they stopped their purchase.
- Reveals the revenue impact of your layout: It helps you identify whether a specific homepage layout or product image block is driving conversions or distracting buyers.
Customer reviews of NS Revenue Heatmap & Replay
The app is in post-launch phase and now free to use. The app’s customer support team has proved to be experienced and responsive.
Who it is best for
This app is best for growth-focused merchants who want to focus on conversion rate optimization. If you need a direct way to see how your page layouts impact your daily sales, this tool is built for you.
1.2. Microsoft Clarity
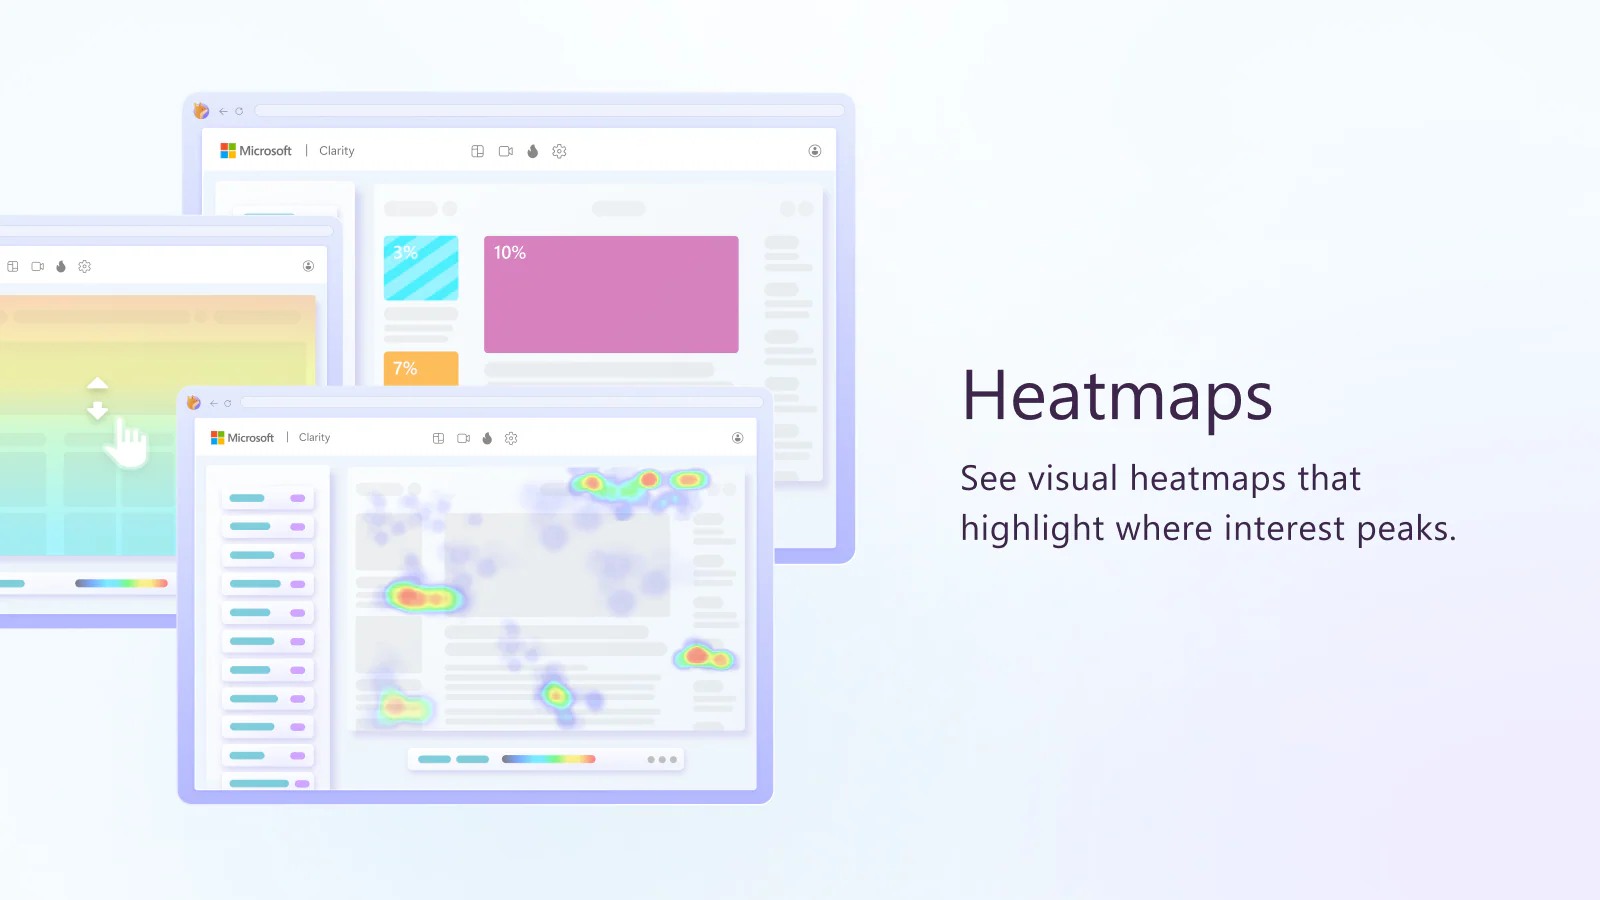
Microsoft Clarity is a completely free user behavior analysis tool. It offers premium features like session replays and heatmaps with no monthly fees. The official Shopify app allows you to connect the tool to your storefront in a few clicks.
Why it’s great for user behavior analysis
- Visual click heatmaps and scroll maps: These maps show you exactly how far down a page your customers scroll before they lose interest.
- Tracks user frustration metrics: It flags “rage clicks,” which happen when a user clicks rapidly on an item that is not a link. It also tracks “dead clicks,” which occur when a user clicks a link but nothing happens.
- Identifies broken elements quickly: Watching these specific recordings helps you find and fix broken layout errors on your pages immediately.
Customer reviews of Microsoft Clarity
Merchants give Microsoft Clarity high marks because it is completely free and supports unlimited recordings. Users state that the tracking script is lightweight and does not impact store loading speeds. Other users mention that the app can encounter bugs or fail if the store has pop-ups.
Who it is best for
This tool is best for budget-conscious beginners and growing stores. If you want detailed visual data without adding a new monthly subscription cost, Microsoft Clarity is your best option.
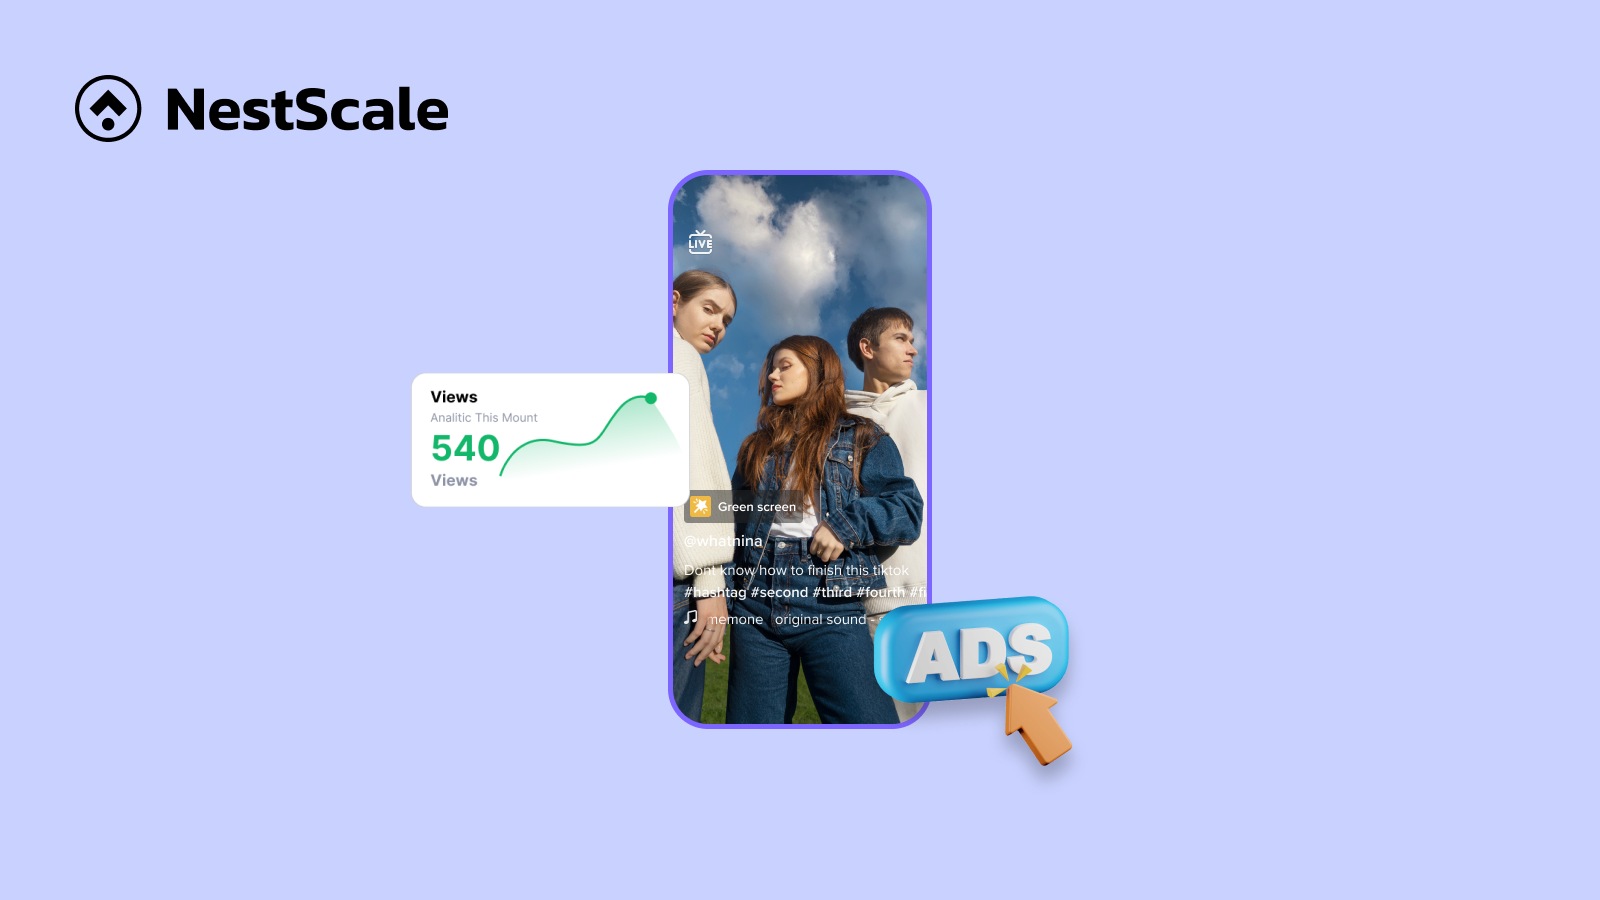
1.3. NestAds
NestAds is a marketing attribution and user tracking tool. It is designed to connect your external ad campaigns with the behavioral patterns of users on your Shopify site.
Why it’s great for user behavior analysis
- Tracks multi-channel customer journeys: It maps the complete path a user takes across different advertising networks before making a purchase on your store.
- Uses first-party tracking: This ensures your data stays accurate even with modern browser tracking limitations and privacy updates.
- Builds a visual timeline for every customer: You can see exactly when a user clicked a TikTok ad, when they returned to browse your catalog, and when they used a Meta ad to buy.
Customer reviews of NestAds
Merchants appreciate NestAds because it is more affordable than enterprise-level attribution platforms. Users state that the data helps them stop spending money on ads that bring in low-quality traffic. Some reviews mention that setting up custom attribution rules requires technical setups to get the best result, though the support team is very responsive.
Who it is best for
NestAds is best for small to medium brands that spend a regular budget on paid ads like TikTok, Meta, and Google. It is ideal if you need to know how your ad traffic behaves after landing on your store.
1.4. Lucky Orange
Lucky Orange is an established optimization tool that focuses on real-time data. It helps you see how visitors use your store right now so you can make immediate updates to your sales funnel.
Why it’s great for user behavior analysis
- Uses dynamic heatmaps: Standard heatmaps only track static pages, but Lucky Orange tracks user behavior on dropdown menus, popups, and sliding banners.
- Includes robust form analytics: This feature shows you which fields take the longest to complete and where users abandon your checkout forms.
- Provides live visitor views: You can watch live sessions as they happen and launch a chat box to help customers who seem stuck.
Customer reviews of Lucky Orange
Users praise Lucky Orange for its helpful customer support and real-time dashboard. Merchants like being able to see exactly how many people are browsing their site at any given moment. Some reviews point out that the interface has a learning curve due to the large number of features. Other merchants state that the lower-tier plans can run out of monthly tracking credits quickly if traffic spikes.
Who it is best for
Lucky Orange is best for proactive store owners who want to engage with their traffic. If you want to analyze forms, look at heatmaps, and use live chat to prevent checkout abandonment, this tool fits your needs.
1.5. Glew.io
Glew.io is a business intelligence tool that looks at customer behavior from a data perspective. It does not use heatmaps or session replays, but it transforms your Shopify order history into detailed customer segments.
Why it’s great for user behavior analysis
- Analyzes long-term purchasing trends: It tracks behavioral metrics like customer lifetime value, purchase frequency, and average time between orders.
- Groups customers into automated behavioral cohorts: It automatically segments your audience into categories like VIP buyers, active repeat buyers, and lapsing customers.
- Identifies high-value products: The platform tells you exactly which products turn one-time shoppers into loyal, repeat customers.
Customer reviews of Glew.io
Users highly value Glew.io for its pre-built customer segments. Merchants state that it saves them hours of manual spreadsheet work every week by organizing data automatically. The primary complaint is the pricing, which is higher than standard Shopify apps. Some users also note that importing historical data can take several hours during the initial setup.
Who it is best for
Glew.io is best for established stores, subscription businesses, and brands with large catalogs. If your main goal is to increase customer retention and analyze purchase trends over time, Glew.io is the right choice.
2. Best Practices for Analyzing Customer Behavior on Shopify
Installing a tool is only the first step. To get real value from your data, you need a clear strategy. Use these best practices to optimize your workflow.
- Exclude internal traffic and bot sessions: Block your own IP address and the IP addresses of your team members inside your app settings. If you do not do this, your own testing sessions will mix with customer data and ruin your accuracy.
- Prioritize pages with high drop-off rates: Check your main Shopify dashboard to find pages with high exit rates. Use your behavior tools on those pages first. If your cart page has a high abandonment rate, filter your recordings to watch users who left from that specific page.
- Search for patterns rather than single events: Do not redesign your storefront based on a single unusual user video. Look for issues that repeat across dozens of sessions, such as a mobile button that is hard to tap.
- Set a consistent review schedule: Do not check your tracking app every hour. Dedicate a single thirty minute block each week to look over your heatmaps and frustration metrics to keep your strategy focused.
👉 Related:
Best CRO Tools for Shopify (2026 Guide)
Best Shopify Heatmap Apps to Improve Store Conversions
7+ Best Shopify Analytics Tools to Optimize Store Performance
FAQs: Shopify Customer Behavior Analytics Tools
Yes, you can track customer behavior on your Shopify store by using heatmaps and session recording tools, such as NS Revenue Heatmap and Hotjar. These allow you to watch real user journeys, where customers click, and analyze how to improve your sales funnel.
Most modern behavior apps use asynchronous scripts. This means the code loads after your main text, images, and products are already visible to your visitor, keeping your store fast.
Google Analytics 4 tells you what actions are happening by tracking page views, bounce rates, and conversion numbers. Heatmaps and replays show you why those numbers happen by letting you watch the visual movement of real users.