







 Marketing Attribution
Measuring the ROI of content marketing is difficult, because the touchpoints (e.g., blog posts, educational guides, newsletters) usually hit users in the mid- and upper-funnel, traditional tracking tools make these assets look completely useless on your reports.
If you have ever struggled to prove that your content strategy is actually driving revenue for your ecommerce store, you are definitely not alone.
Fortunately, Multi-Touch Attribution (MTA) opens the door to a much more effective approach. Instead of forcing you to guess, MTA allows you to see exactly how your various content pieces collaborate to turn a casual browser into a paying customer.
💡 Key Takeaways
- Why do traditional tracking metrics fail to show the true value of content marketing? Most content assets work in the upper and middle stages of the funnel to educate and build trust. Single-touch metrics only credit the very first or very last click, making those content appear low-converting on paper.
- How does a multi-touch attribution model help measuring content marketing ROI? A multi-touch attribution model distributes conversion credit across multiple content interactions. This ensures your awareness articles, email newsletters, and buying guides all get their fair share of revenue credit instead of giving all the credit to the final ad click.
- How to effectively track content marketing performance? By observing how interactions across different touchpoints function together as a unified system, you can easily see what actually pushes people to buy. This insight allows you to allocate your marketing budget with high accuracy and optimize campaigns around content that truly influences decisions.
In this article, we will show you how to utilize MTA for measuring content marketing ROI.
Step 1: Identifying Content Objectives Across the Buyer’s Journey
Before we can even talk about implementing a multi-touch attribution model, you need to categorize your content by its specific business objective. Let’s break down how to look at these assets.
Top-of-Funnel Content: Driving Awareness and Engagement
Top-of-funnel content serves as the entry point for cold audiences. At this stage, your primary objective is to capture attention, solve an initial problem, or entertain an audience that has never heard of your brand.
This content usually includes educational blog posts, high-level style guides, lifestyle articles, and interactive landing pages. The goal here is simple: engagement. You are measuring how effectively this content introduces your brand to potential buyers.
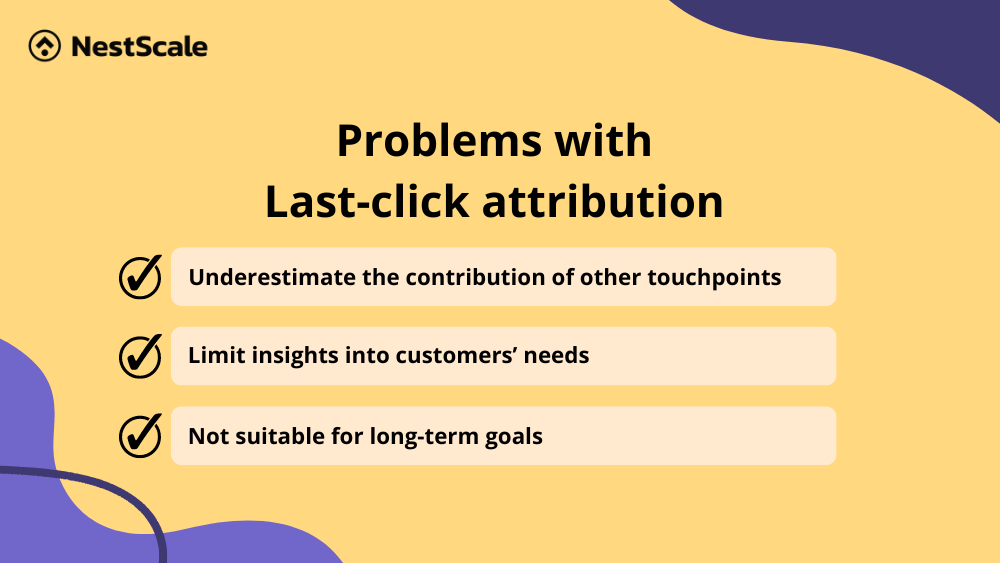
When you look at traditional last-touch reporting, these top-of-funnel assets almost always show a zero percent conversion rate. If you rely solely on that data, you will end up pausing content budgets that are actually feeding your early traffic.
Middle-of-Funnel Content: Educating and Nurturing Prospects
Once a user knows who you are, they move into the consideration phase. This is where middle-of-funnel content takes over. Your objective now shifts from broad engagement to specific education and risk reduction.
Middle-of-funnel content answers the nuanced questions a consumer asks before spending their money. They are weighing your product against competitors or figuring out if your specific solution fits their lifestyle.
In my experience, this middle stage is typically where customer journeys stall out. By identifying these pieces as nurturing assets, you can monitor how effectively they keep a prospect warm and move them closer to an active buying state.
Bottom-of-Funnel Content: Driving Conversions
Finally, we reach the bottom of the funnel. This is the home stretch where your transactional content lives, including Google Shopping ads, Facebook retargeting ads, brand search campaigns, and your actual product landing pages.
As I already mentioned, these bottom-funnel assets are incredibly easy to track because they sit directly next to the checkout button. Because of this, standard analytics tools love to give them 100% of the sales credit. But in a multi-touch world, we view these ads and product pages as the closer of the deal, not the sole creator of the deal. They are the final touchpoint in a long line of previous brand interactions.
Relevant reading: Last-touch vs Multi-touch Attribution: Can MTA Replace LTA?
Step 2: Selecting the Right Multi-Touch Attribution Model for Each Content Objective
Once you have organized your content assets by their respective funnel stages, you need a tracking framework that recognizes their contributions.
This is where the specific mechanics of a multi-touch attribution (MTA) model come into play.
There are several specific models within the broader MTA landscape, and each distributes revenue credit differently:
| MTA Model Type | How Credit is Allocated | Best Business Use Case |
|---|---|---|
| Linear (Recommended) | Distributed equally across every single touchpoint. | Overall content library health and broad brand awareness strategies. |
| Time-Decay | Credit increases as the touchpoint gets closer to the final purchase. | Short-term promotional campaigns and seasonal e-commerce sales. |
| Position-Based | Gives 40% to first click, 40% to last click, and splits 20% in the middle. | Lead generation and tracking early brand discovery alongside the final sale. |
| W-Shaped | Gives 30% to first touch, 30% to lead creation, 30% to final sale, and splits 10% in the middle. | Complex, multi-stage B2B or high-ticket e-commerce customer journeys. |
| Data-Driven | Calculated algorithmically based on your store’s historical path outcomes. | Complex multi-channel stores with high monthly conversion volumes. |
As you can see from the table, you have plenty of options to choose from. However, if you want my honest personal opinion, the absolute best model for content marketing is the Linear Model.
I highly recommend starting with the Linear model if you are moving away from last-click tracking for the first time. It is an excellent, low-barrier framework for teams that need to justify their content production spend.
Because a linear setup shares conversion credit equally across all touchpoints, it acts as a clean starting point that ensures early-stage educational content is visible in reports.
Step 3: Mapping the Customer Journey
Measuring your content accurately requires looking at the big picture. Many digital marketers make the mistake of analyzing their ad platforms, email software, and website blogs as separate, isolated buckets.
When you map out a true multi-touch customer journey, you dissolve those artificial barriers. You begin to see that every channel influences the other, and a purchase is the result of multiple touchpoints’ effort.
Optimizing Campaigns and Budget Allocation Based on Real Influence
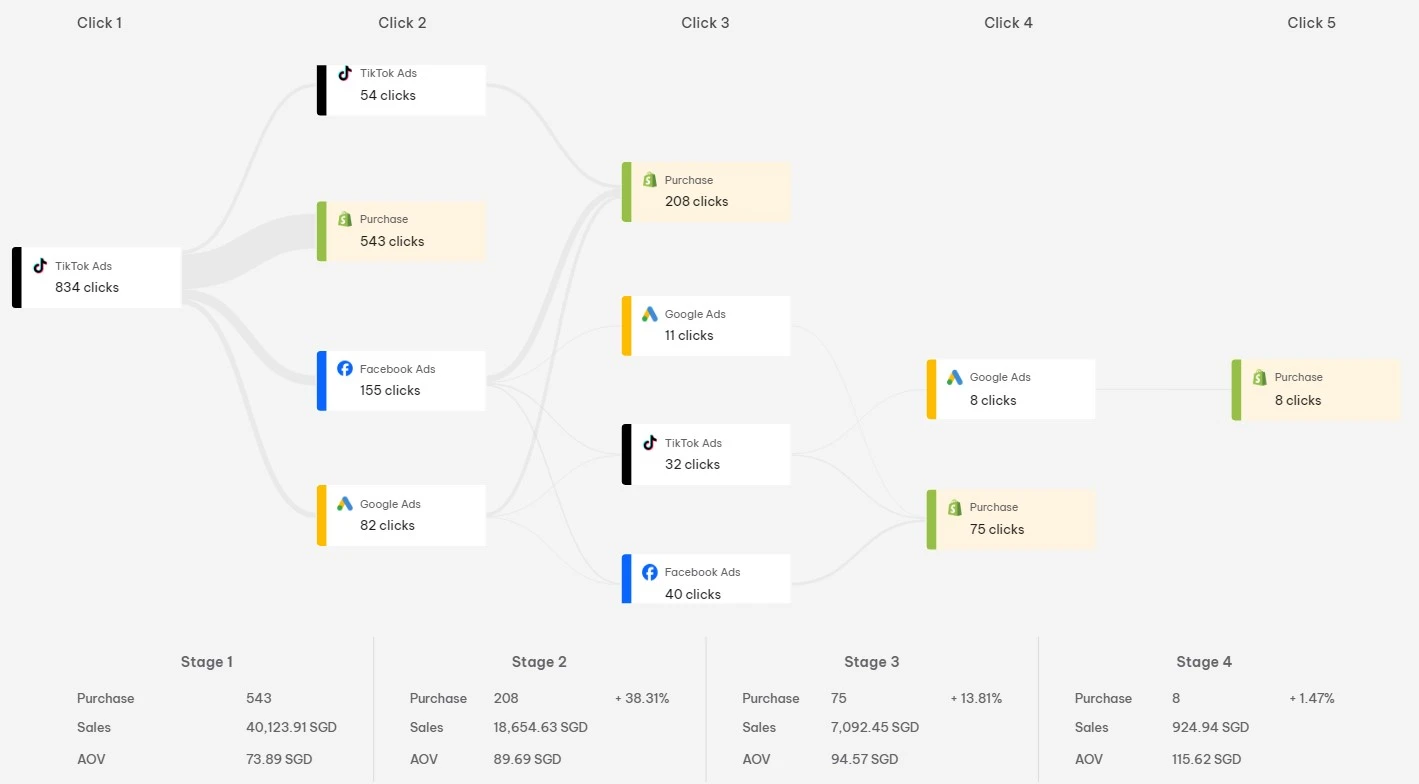
Seeing the connected path gives you an immediate competitive advantage when managing advertising accounts or marketing budgets. This helps allocate your marketing budget more accurately and makes it easier to optimize campaigns based on the channels and content that truly influence conversions.
If you notice that a specific top-of-funnel blog post routinely appears at the start of high-value customer journeys, you can confidently allocate more paid ad budget to drive cold traffic directly to that article.
Conversely, if an expensive paid social campaign is generating traffic that never interacts with your middle-of-funnel educational assets or email flows, you can systematically scale back that ad spend. You stop guessing which elements work and start funding the exact assets that push users down the path to purchase.
Step 4: Metrics to Measure Content Performance at Each Stage
When dealing with complex customer tracking, looking for absolute, permanent certainty is a trap. User privacy updates, cross-device browsing, and browser changes mean your tracking data will never be completely physically flawless.
Instead, successful e-commerce growth teams focus on relative measurement. You want to monitor data trends, directional shifts, and relative performance ratios over time to guide your creative and financial adjustments. Here is how I look at these performance metrics.
Assisted Conversions
The primary metric to monitor is the assisted conversion value. An assisted conversion occurs whenever a content asset appears somewhere along a buyer’s path but is not the final click that closed the transaction.
Measuring assisted conversions allows marketers to move away from rigid “last-click” attribution models. Your team can accurately prove the financial ROI of top-of-funnel awareness content that nurtures leads long before they are ready to buy.
Content Velocity
Content velocity measures the speed at which a user moves from their initial brand discovery to their final checkout. Multi-touch attribution tracking allows you to segment your buyer journeys into two groups: those who read your mid-funnel content and those who do not.
By tracking this relative difference, you can measure path length interaction. Look closely at your data to determine whether users who consume your educational articles or detailed product guides require fewer total touchpoints before purchasing. If your content library successfully reduces the average customer decision window from fourteen days down to four days, your content is directly accelerating your overall business cash flow.
Evaluating Content Marketing ROI with MTA
At the end of the day, running an ecommerce brand across multiple platforms without a clear view of your customer journey will soon hinder business growth.
Implementing Multi-Touch Attribution gives content marketers a more holistic view of how customers interact with different touchpoints, on different platforms.
If your business is currently scaling campaigns across Meta, TikTok, Google Shopping, and automated email flows all at the same time, trying to stitch this data together manually in a spreadsheet is a massive headache. This is exactly where NestAds customer journey tracking and MTA models come in. It gives you the exact data confidence you need to scale up your content budget, optimize your ad targeting, and stop wasting money on channels that do not influence the checkout.
If you are ready to stop guessing and start making data-driven decisions, get started for free or book a demo to see how NestAds work.
FAQs: MTA for Content Marketing Measurement
Single-touch attribution gives 100% of the financial credit to just one interaction, usually the very first click or the final click. Multi-touch attribution distributes that dollar value across several interactions instead, ensuring your mid-funnel educational articles and newsletters get recognized alongside your bottom-funnel conversion ads.
High traffic paired with low attribution usually means your content is targeting an irrelevant keyword, or you are failing to guide users to the next stage. I recommend adding contextual internal links to your mid-funnel assets, embedding clear email signup boxes, or placing relevant product recommendation grids directly inside the article to keep the user moving.
Linear model is a great starting point because it breaks the habit of last-click reporting, but I do not recommend it as a permanent fix. Because it splits credit completely evenly, it treats a brief three-second glance at a top-of-funnel article exactly the same as a high-intent deep dive into a product specification page. That’s why you should map the customer journey to know the role of each touchpoint.





 Facebook Advertising