

To run your e-commerce business effectively, understanding your conversion rate is essential. This guide aims to delve deep into what GA4 e-commerce conversion rate entail, how to monitor them effectively, and how to analyze it for the most practical insights. Whether you’re a seasoned marketer or a business owner, mastering GA4 can transform your approach to digital analytics.
Overview of GA4 e-commerce conversion rate (Plus latest update from Google)
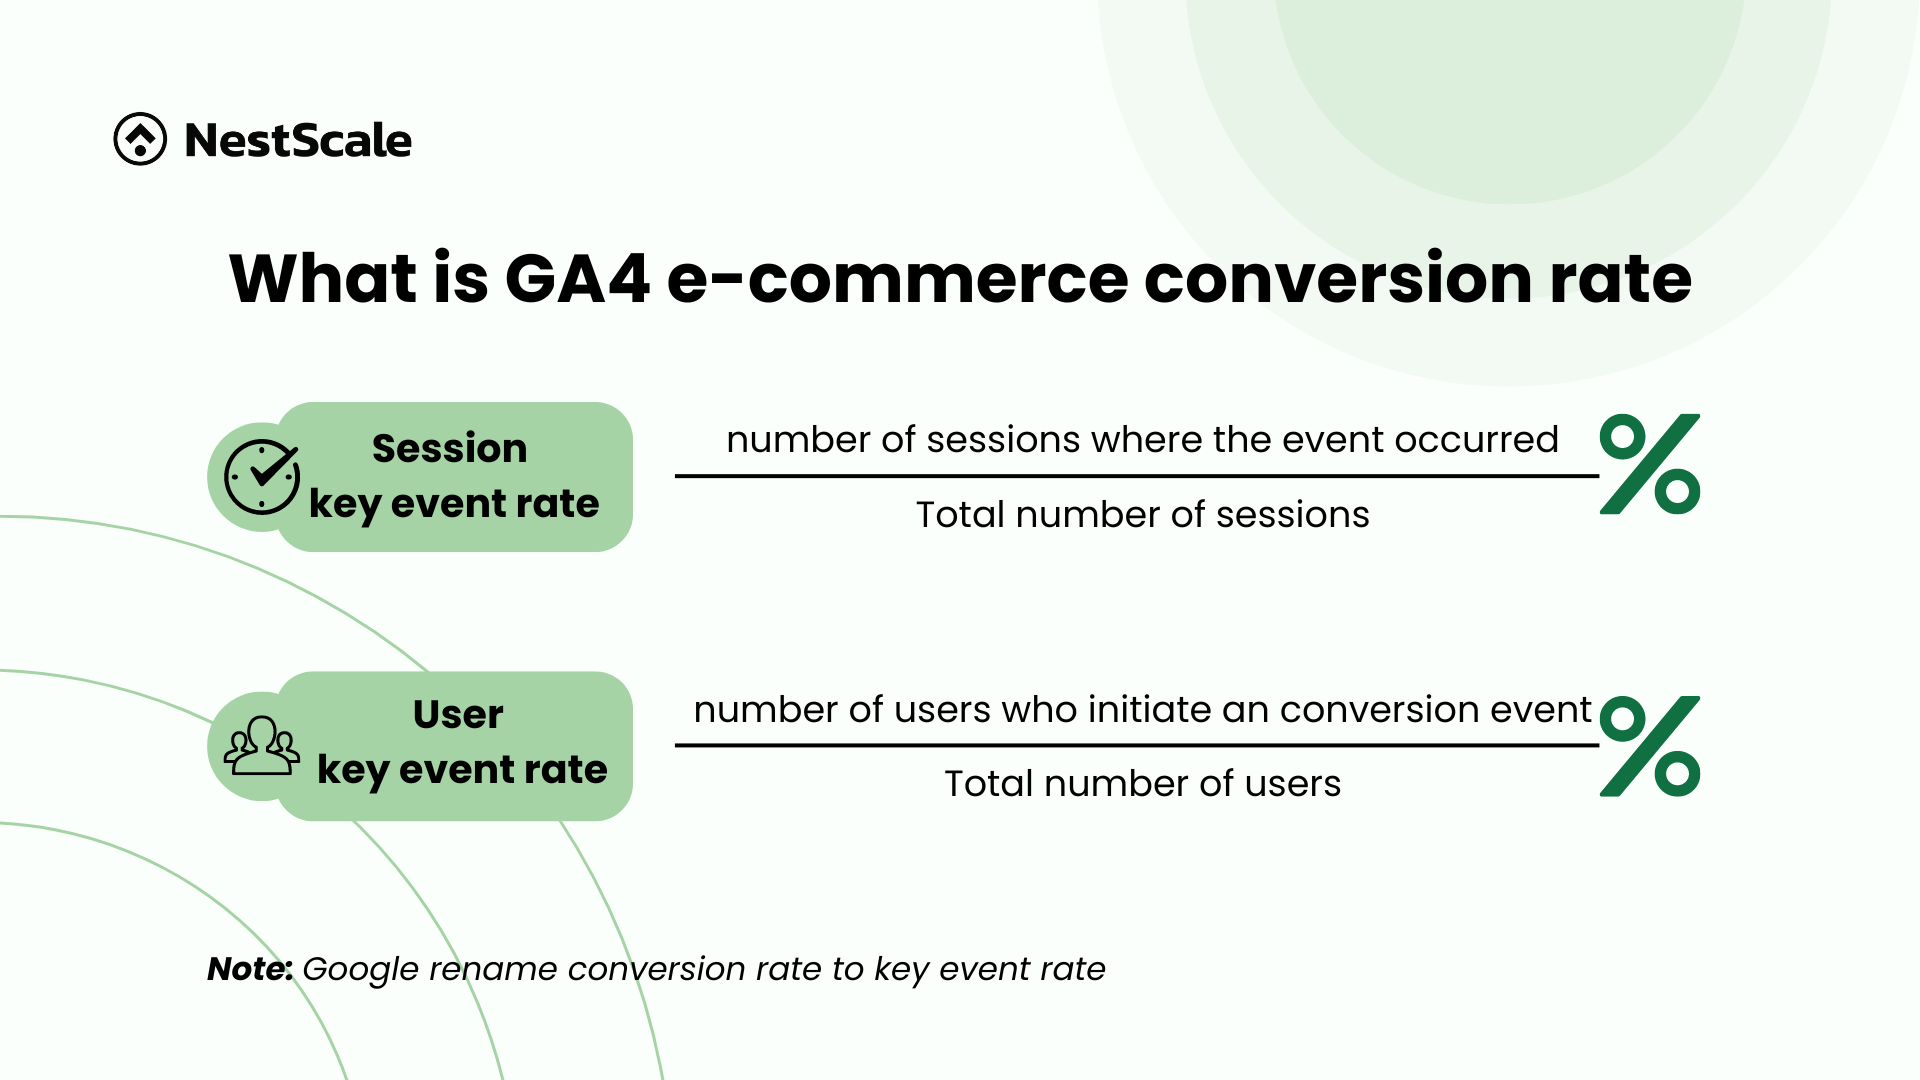
For e-commerce stores, tracking conversion rates is essential for gauging the effectiveness of their online presence. Previously, the e-commerce conversion rate was a straightforward metric in Google Analytics. This rate was categorized into two types: Session Conversion Rate and User Conversion Rate. These measure the number of conversions per session and the number of conversions per user, respectively.
However, as of March 2024, Google has standardized terminology across its platforms, including Google Ads, by changing conversion to key events. So, if you’re having trouble finding the conversion rate in your GA4 metrics, don’t be confused. Simply look for key event instead.
Just like the old conversion rate, you will also have 2 types of key event rates to track for your store:
Session key event conversion rate
The Session Conversion Rate is determined by dividing the number of sessions where at least one conversion occurred by the total number of sessions. This metric is invaluable for assessing the immediate impact of specific actions or changes, such as launching a new marketing campaign or making website modifications.
User key event conversion rate
The User Conversion Rate offers a comprehensive perspective on how effectively an e-commerce platform engages and converts users over time. This metric is calculated by dividing the number of unique users who have initiated any conversion event by the total number of users during a specific period. Unlike the Session Conversion Rate, the User Conversion Rate helps you assess the long-term effectiveness of your marketing strategies and user engagement initiatives.
How to track GA4 e-commerce conversion rate?
Firstly, to thoroughly understand conversion rates within Google Analytics 4, it’s important to know how to track them. Here are the steps you should follow to do this:
Set your key events
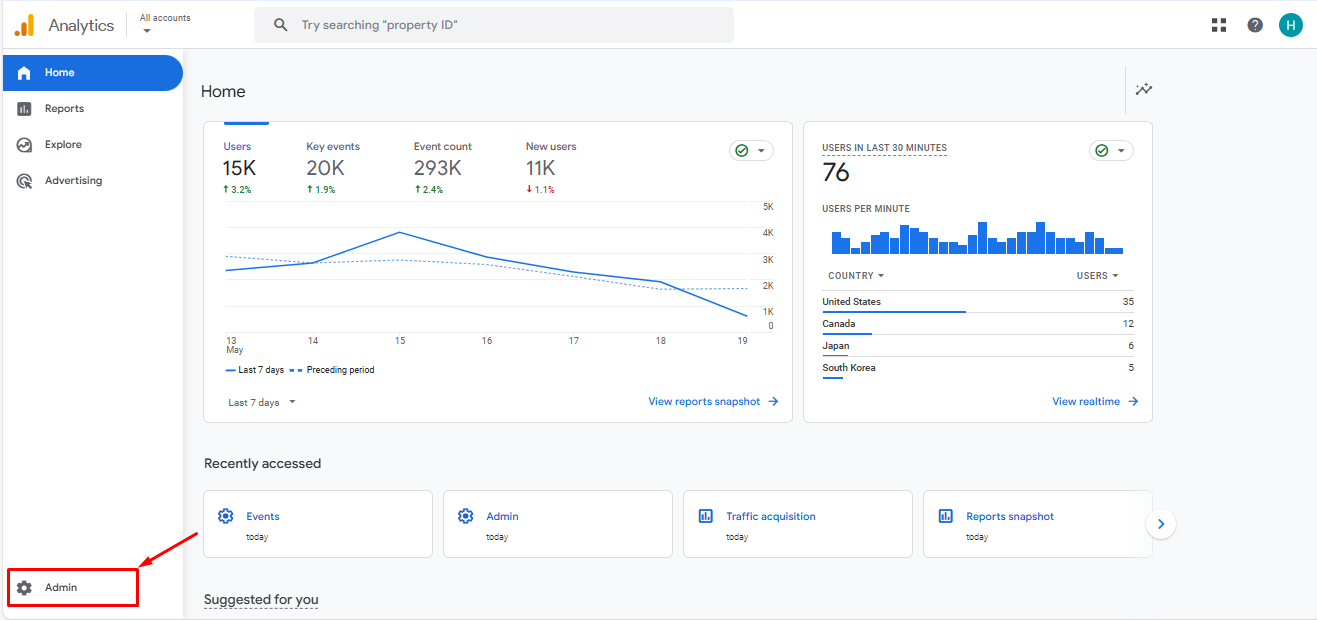
In order to track conversion for an event, first, you need to set that event into key event. To do this, navigate to Admin at the bottom left of your dashboard.
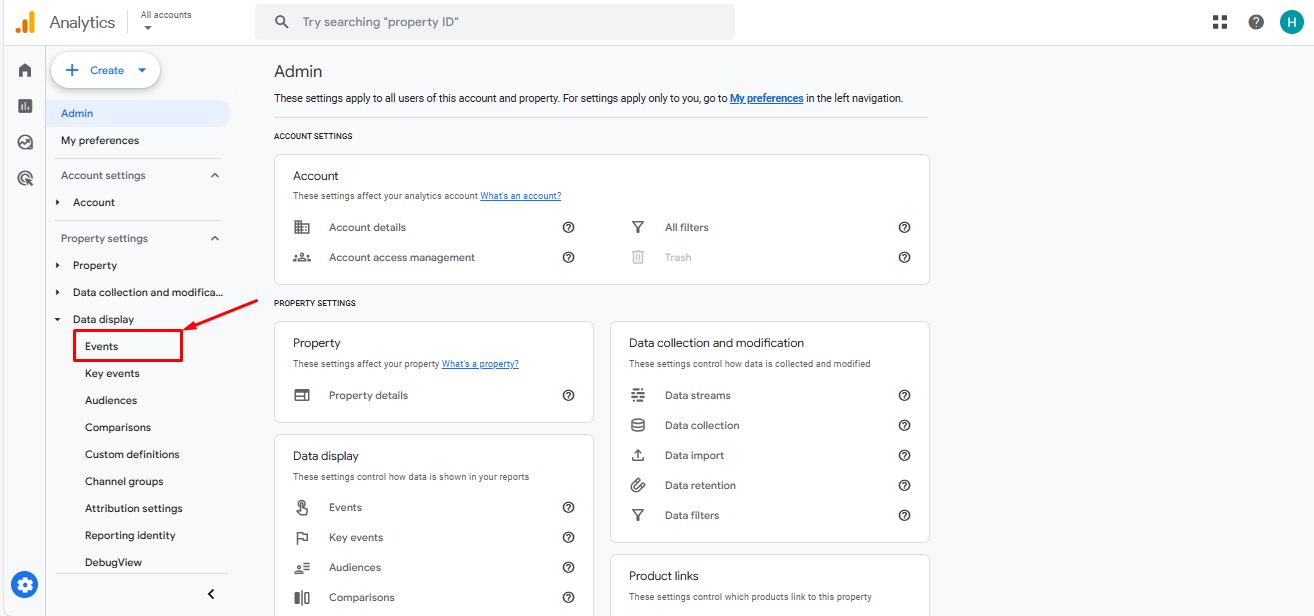
Click on Data display, then go to Events.
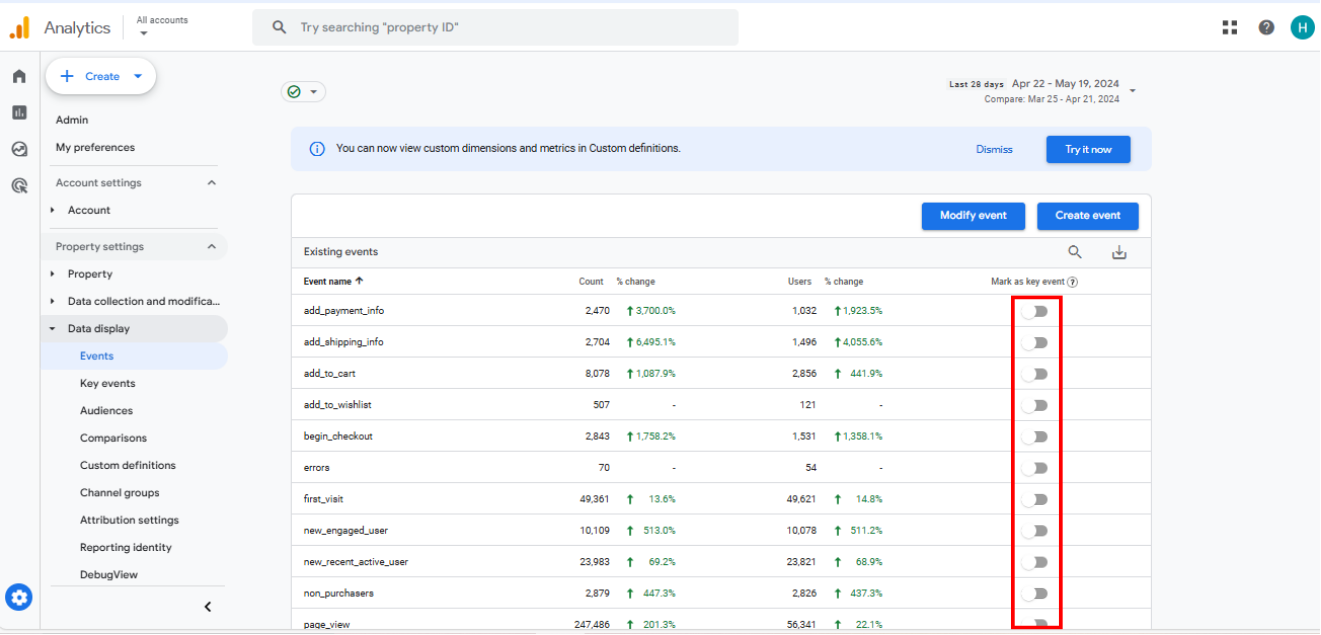
After going into your Google events dashboard, you will see a column with the toggle to Mark as key event. Search the event you need, then turn the toggle on to make that event the key event for tracking.
Track conversion rate within Reports
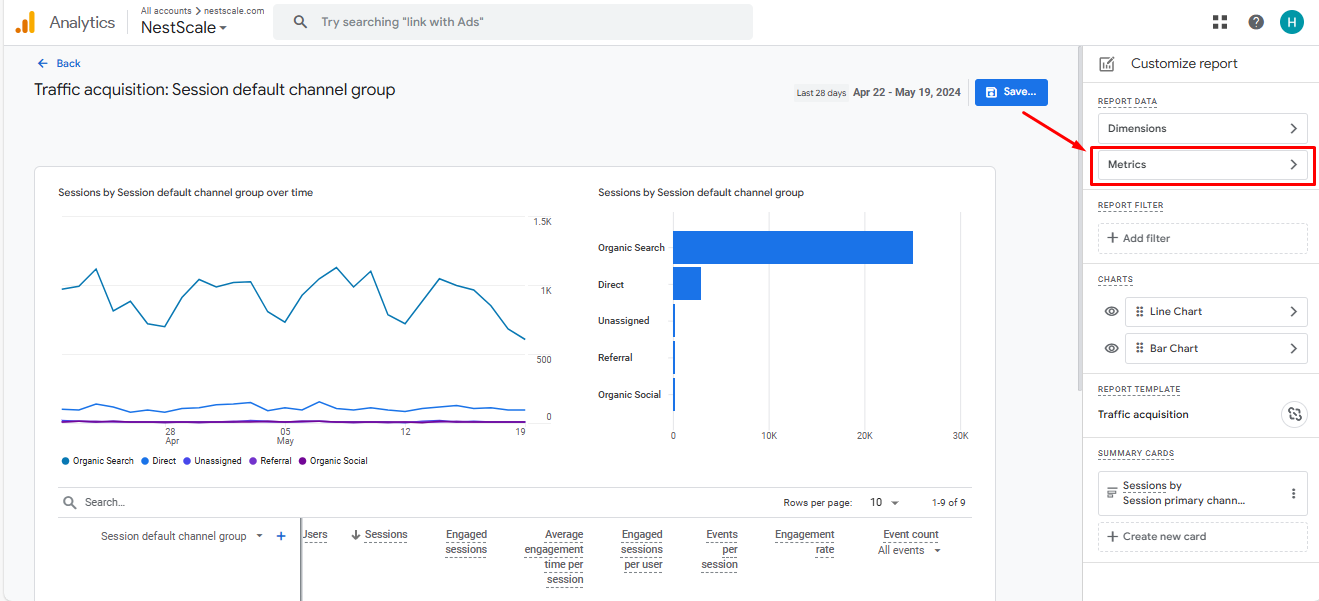
Once you’ve set up your key events, it’s time to start monitoring your data. The first way you can do this is through setting up your GA4 reports. You can easily customize the metrics you want to track with just a few adjustments. Here’s how to customize your report in GA4:
Click on Customize report at the top-right corner of the screen.
Select Metrics.
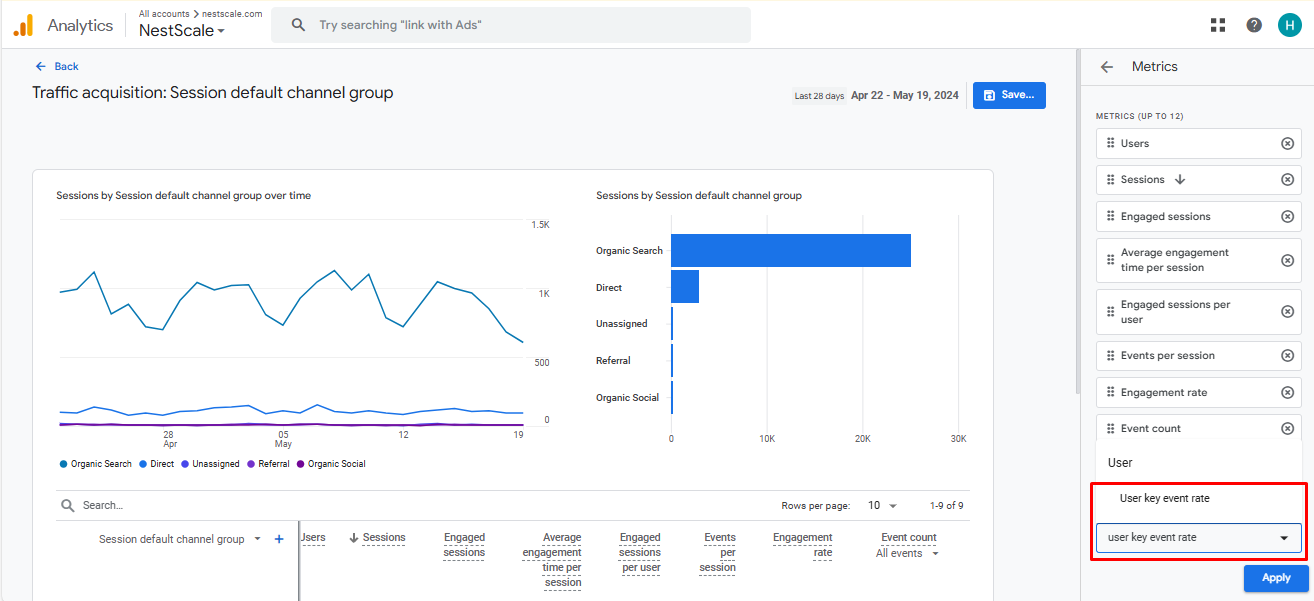
Next, click on Add metric. Search for the User key event rate or Session key event rate metric using the search box. Once you find it, click on Apply.
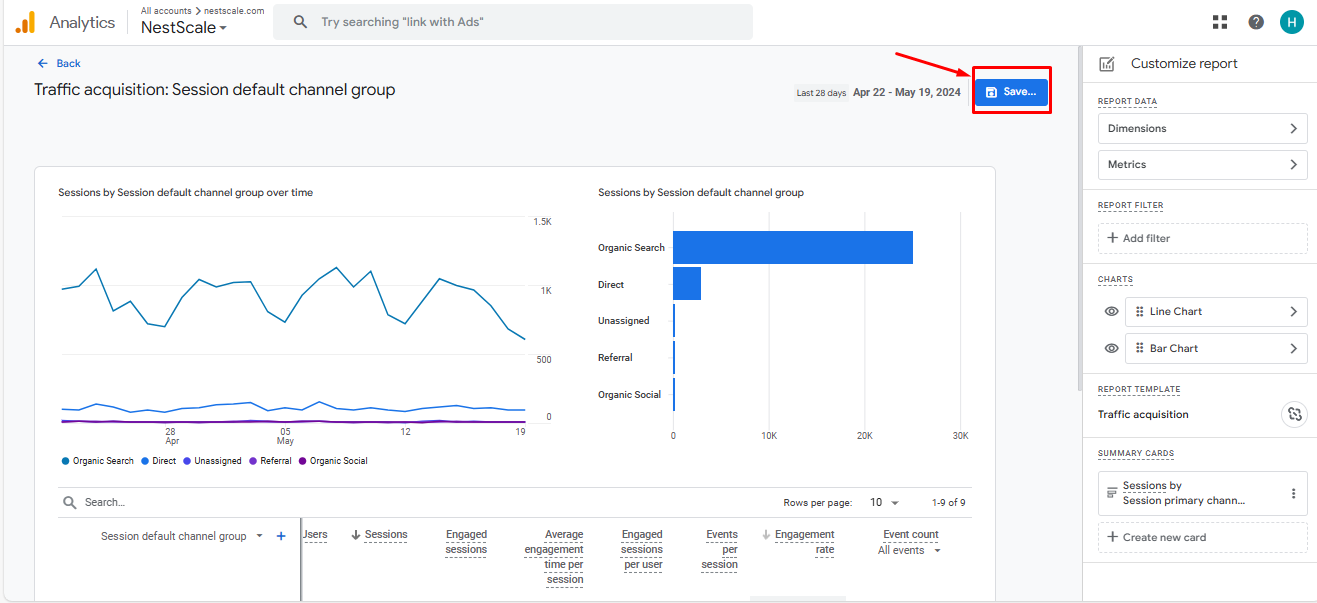
Finally, click on Save.
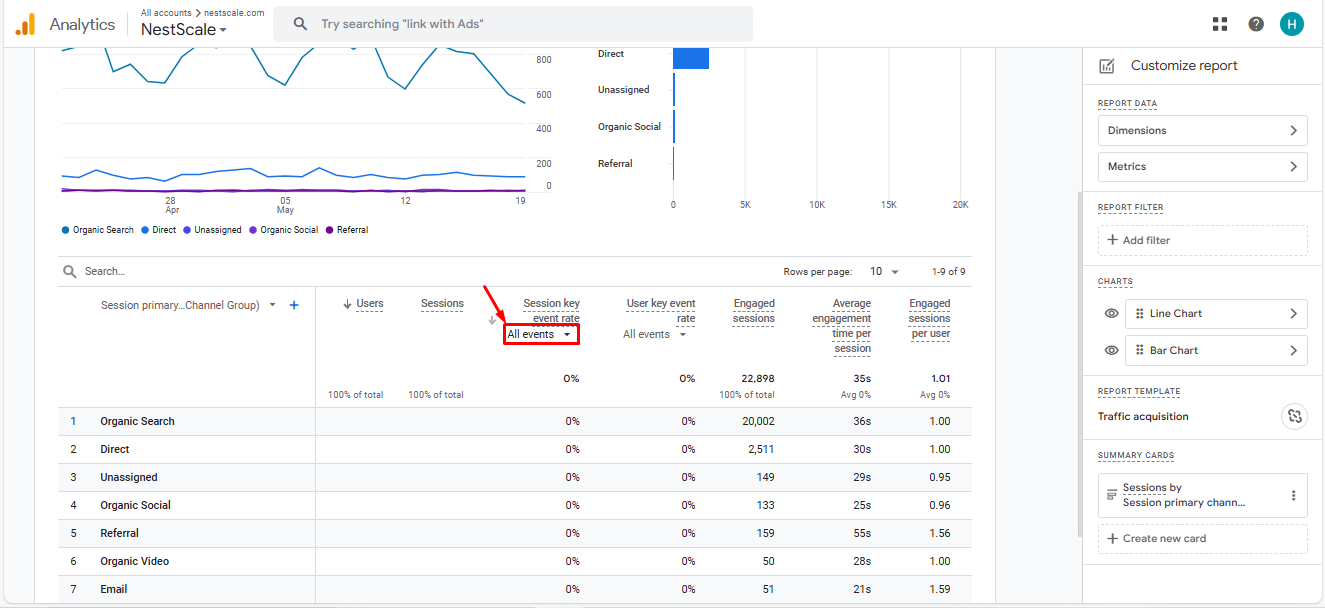
Now, you can view the conversions in your traffic reports. GA4 automatically displays the conversion rate for all key events. Therefore, if you wish to see the conversion rate for each specific event, simply select the desired event under the conversion rate column.
Track conversion rate within Exploration
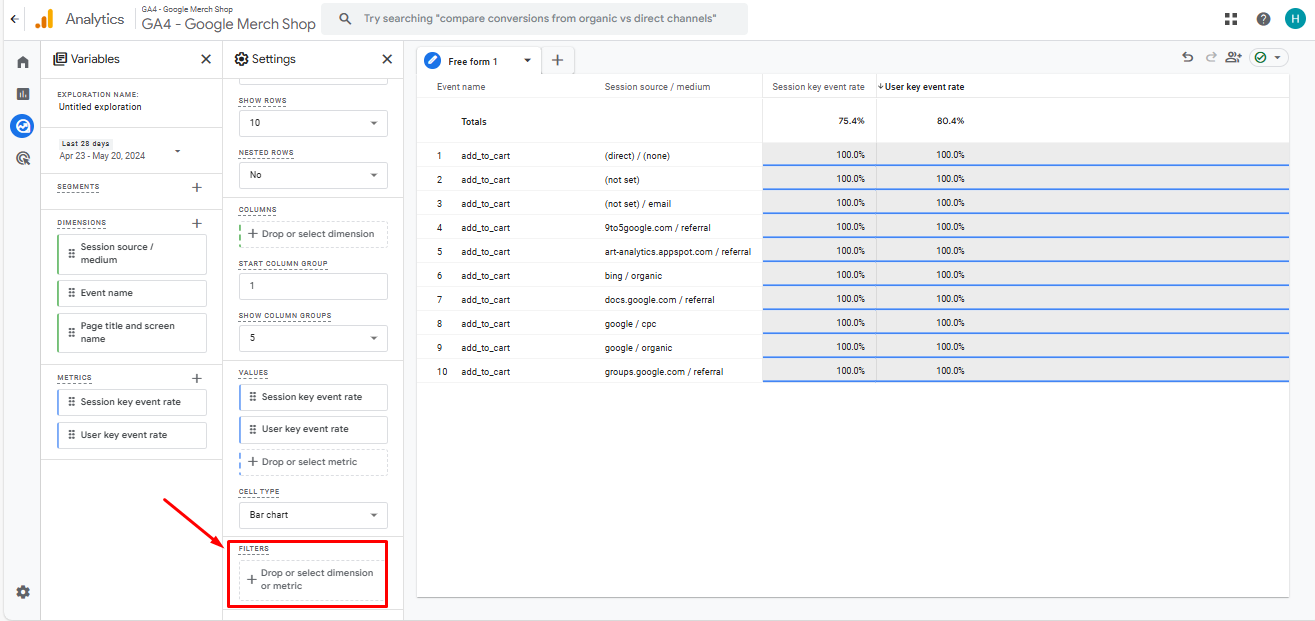
Another way to track your conversion rate is by setting up an Exploration in GA4. This method essentially provides the same results as using reports to view metrics. However, exploring your key event conversion rate within the Explore section offers more flexibility to delve deeper into your data and customize the view according to your specific needs.
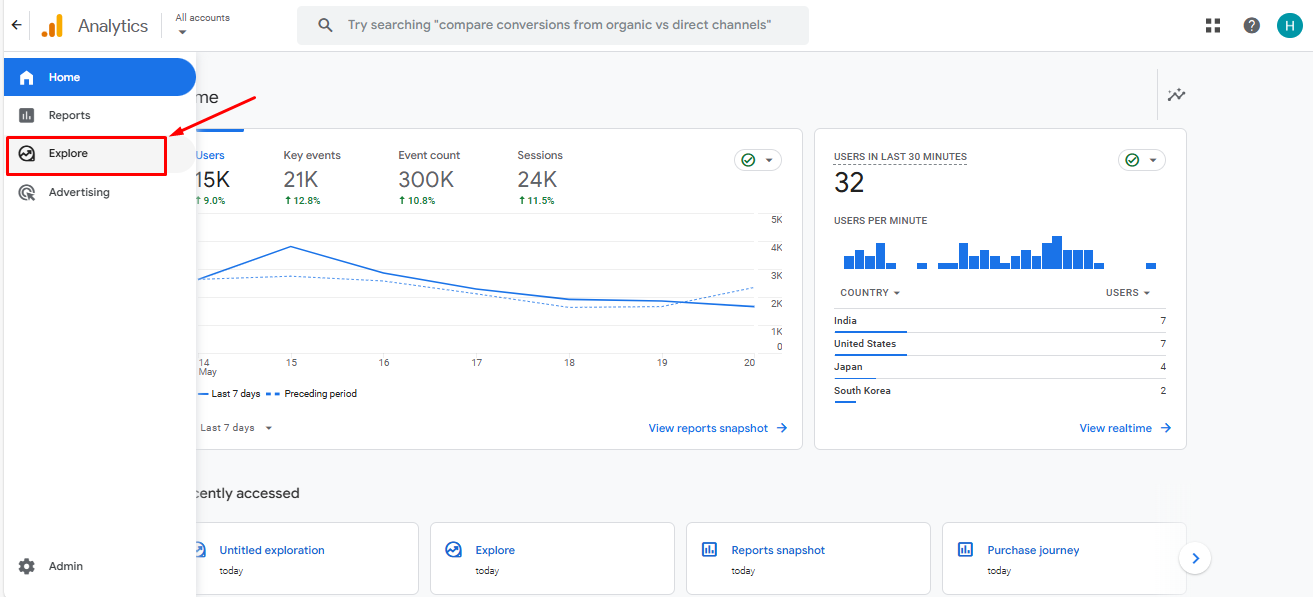
To begin, click on Explore in your GA4 dashboard.
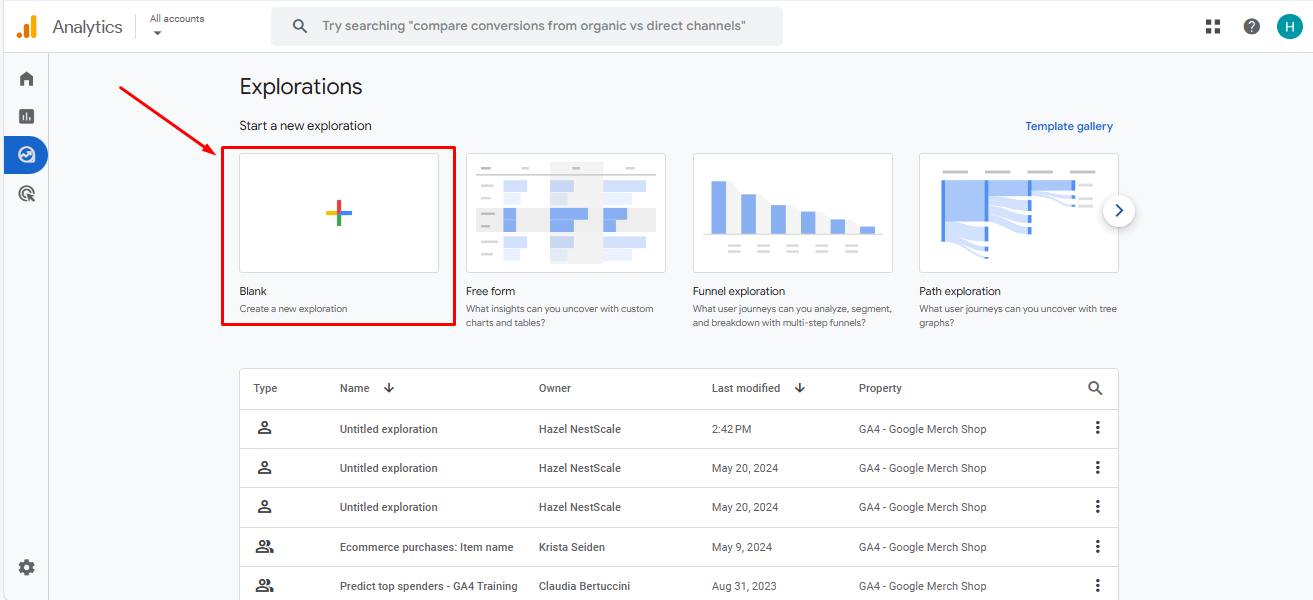
Then, click on Blank to create a new exploration
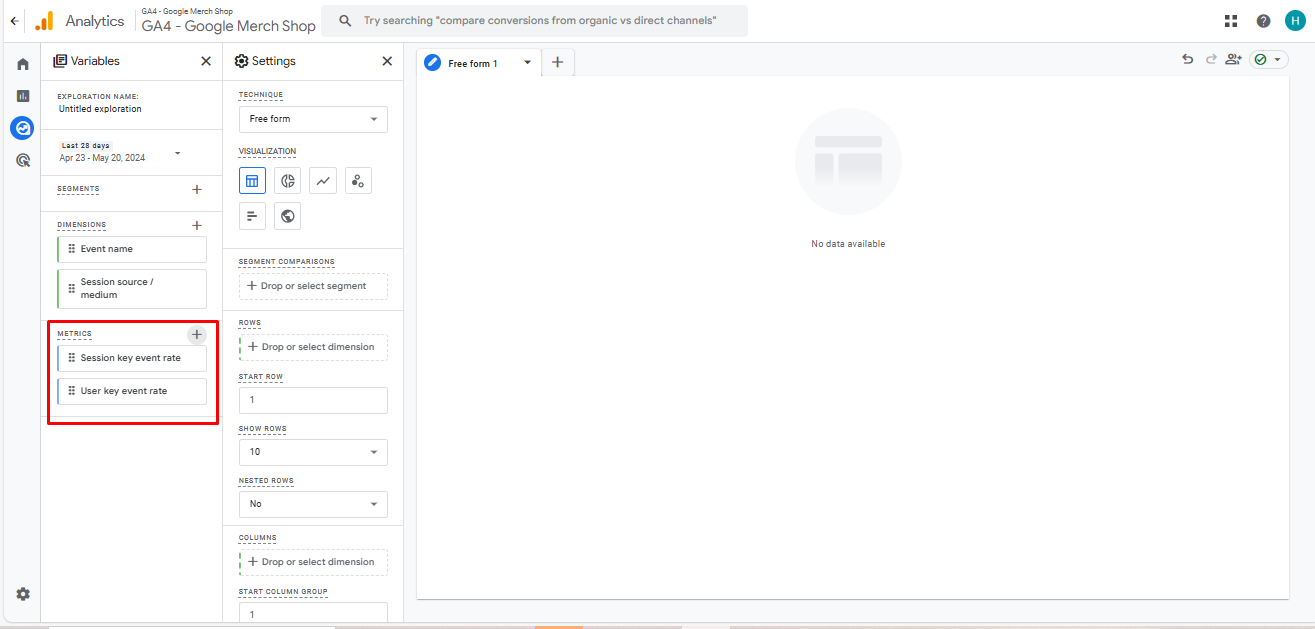
Once you’re in the exploration space, you’ll find numerous options to customize the view according to your needs. However, since we are focusing on conversion rates, the only two metrics you should select are the Session key event rate” and User key event rate.
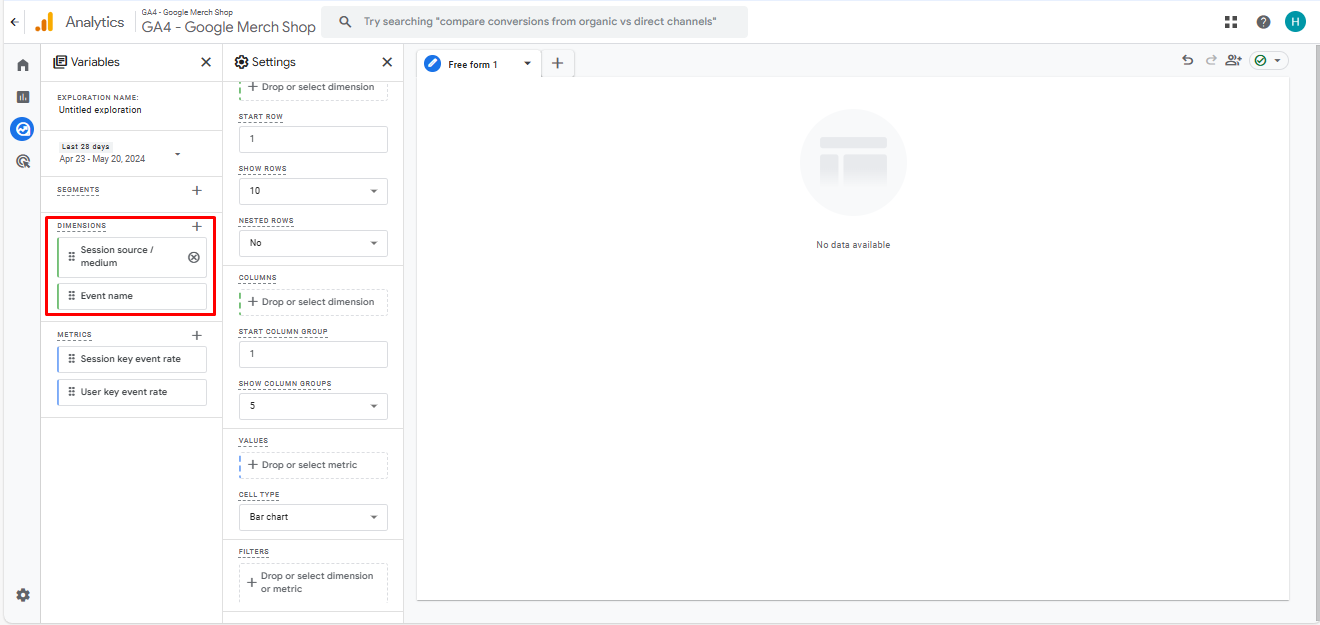
For dimensions, choose Event name in the event section and Session Source/Medium in the traffic section. After setting these, click on Import.
After that, drag the Dimension into the row section and the Metric into the value section. Now, you will clearly see your e-commerce conversion rate displayed. You can also create a filter to narrow down your data view for more focused analysis.
3 tips to effectively analyze your conversion rate
Now that you’re familiar with tracking conversion rates in Google Analytics 4, let’s take a step further into mastering the art of analyzing these metrics to drive your e-commerce success. It’s not just about monitoring numbers; it’s about understanding the stories they tell and how you can use them to optimize your strategies.
Here’s a breakdown of actionable tips you can employ to not only track but also significantly improve your conversion rate.
Compare your conversion rate regularly
To effectively analyze your conversion rate, we recommend tracking this metric weekly for optimal results. While setting a benchmark is useful for establishing goals, the most valuable insights come from continuously comparing your conversion rates against previous periods.
For example, if you compare this week’s conversion rate to last week’s and notice a decrease, consider the following:
- Were there any special events last week that might have boosted sales?
- Did you run any marketing campaigns last week that increased sales? If so, was the increase worth the investment?
- What steps can you take to maintain or improve your conversion rate this week?
Identify the source of growth
It’s also crucial to identify the most effective sources driving conversions to your store. In GA4, pay close attention to which sources yield the best conversion results. Here are some strategies to enhance your analysis:
- Use Source/Medium dimensions: Drill down into your traffic by examining the source/medium dimensions. This distinction helps identify which marketing channels (such as organic search, social media, email marketing) are most effective at driving conversions.
- Segment by campaign: If you’re running multiple campaigns, differentiate the data using the campaign parameter. This allows you to see which specific marketing efforts are performing best, helping you allocate resources more effectively.
Utilize 3rd-party data analytics to enhance your view
For Shopify merchants aiming to maximize their e-commerce conversion rate insights, integrating third-party data analytics tools alongside GA4 is a strategic move that can significantly enhance your understanding and optimization of customer interactions. Here’s why and how you can leverage these tools effectively:
- Comprehensive conversion insights: Third-party tools often provide specialized metrics and deeper insights into specific aspects of the conversion process that GA4 might not cover in detail, such as micro-conversions (e.g., adding a product to a cart, signing up for a newsletter) or detailed cart abandonment analytics. For the best accuracy, we recommend you use tools that can implement server-side tracking, as they lower the chance of missing out any valuable data.
- Tailored e-commerce features: Many third-party analytics tools are designed with e-commerce specifically in mind, offering features that directly address common merchant challenges, like product performance analysis, customer lifetime value, and retention rates.
So, how can you complement your GA4 with third-party tool data?
- Layering data for enhanced analysis: Use third-party tools to drill down into niche areas of your store’s performance. For example, if GA4 shows a high level of traffic but low conversion rates, a third-party tool could help analyze specific user interactions that indicate where potential customers drop off or lose interest.
- Filling in the gaps: Utilize third-party tools to gather data that GA4 does not capture effectively, such as in-depth social media interaction analytics or specific user feedback and surveys that can influence purchasing behavior.
Let’s enhance your conversion rate effectively
Looking to fully understand and boost your e-commerce conversion rate? Explore what NestAds can do for you. Our platform is specifically crafted to improve the efficiency and effectiveness of your e-commerce analytics. With NestAds, you get customizable reporting that’s specially tailored to meet the unique demands of e-commerce businesses. This means you can focus on key performance metrics and generate detailed reports that provide targeted analysis and practical insights.
Furthermore, NestAds allows you to consolidate data from various platforms, enabling you to make data-driven decisions that enhance your store performance. Interested in seeing how it works? Install NestAds today to see how it can contribute to the growth and success of your e-commerce venture.