

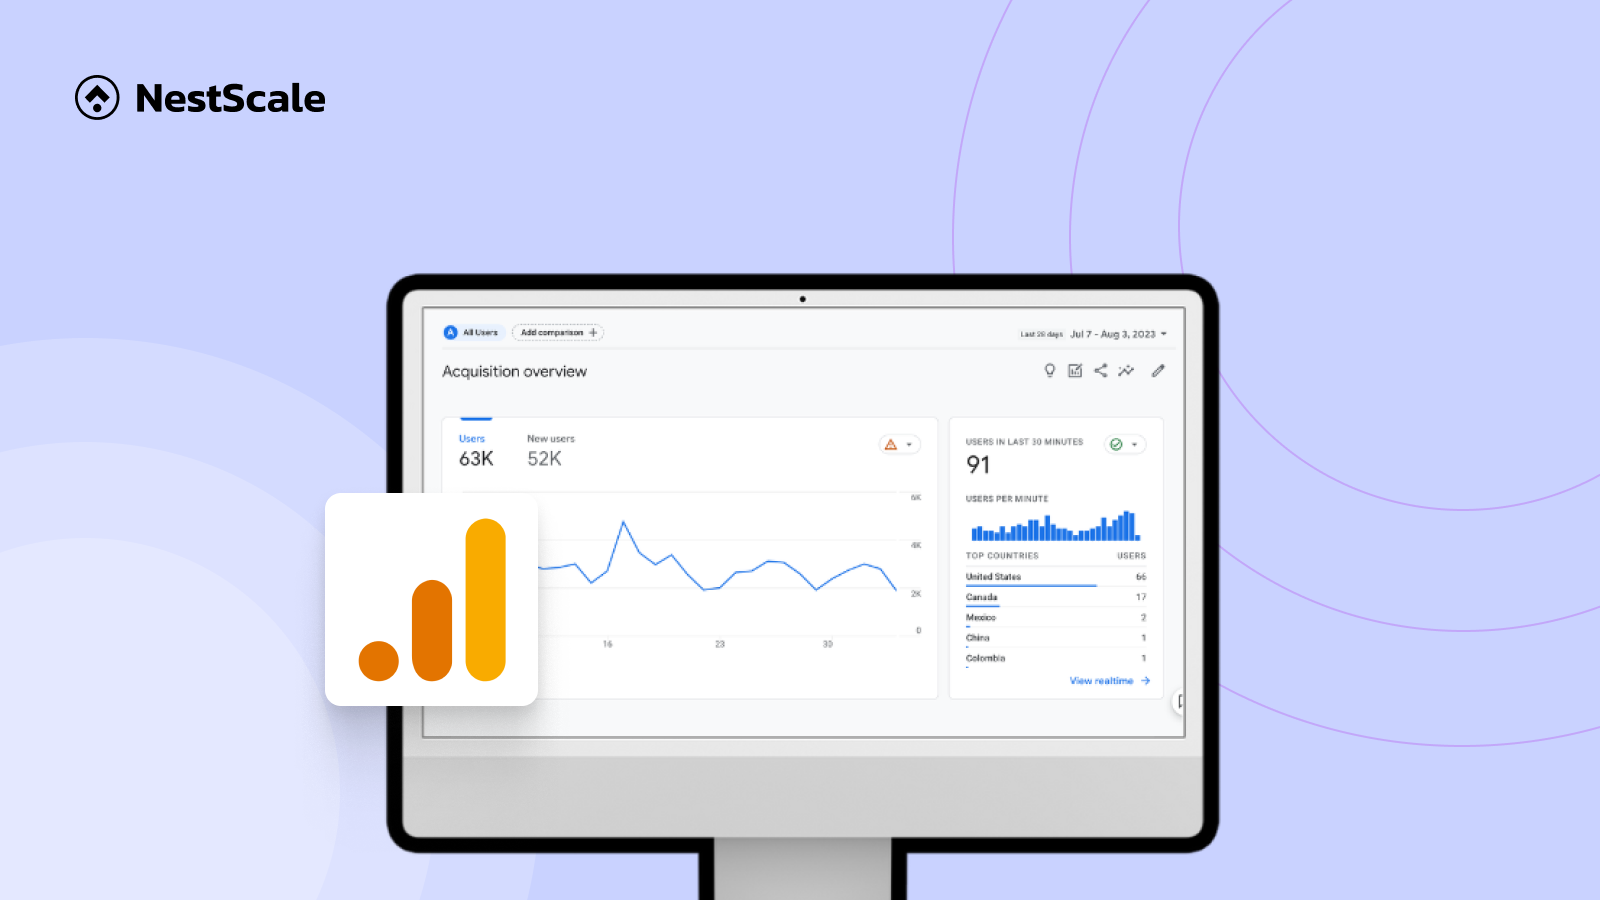
In today’s rapidly evolving digital landscape, understanding customer behavior, optimizing marketing strategies, and maximizing ROI are essential for success. With GA4 e-commerce reports, businesses gain access to advanced analytics capabilities that provide deep insights into user interactions, e-commerce performance, and audience segmentation.
In this blog, we’ll explore an overview and 3 key GA4 e-commerce reports. Whether you’re a seasoned marketer or new to the world of analytics, this guide will help you harness the power of GA4 reports to propel your business forward. Let’s dive in!
Overview of GA4 e-commerce reports
Google Analytics 4 (GA4) introduces a comprehensive set of e-commerce reports, providing online merchants with deeper insights into their sales performance, product data, and customer journeys. With the enhanced tracking capabilities, these reports can offer you valuable data for store optimization.
Moreover, GA4 marks a departure from the traditional Universal Analytics platform, offering a more flexible and robust approach to e-commerce tracking. While Universal Analytics only provides standard e-commerce reports, GA4 takes it a step further by offering advanced features and deeper insights into user behavior and interactions.
3 key e-commerce reports in GA4
Google Analytics 4 e-commerce reports are organized into several categories, each focusing on specific aspects of your online store’s performance. Here’s an overview and how to see 3 main e-commerce reports in GA4 available:
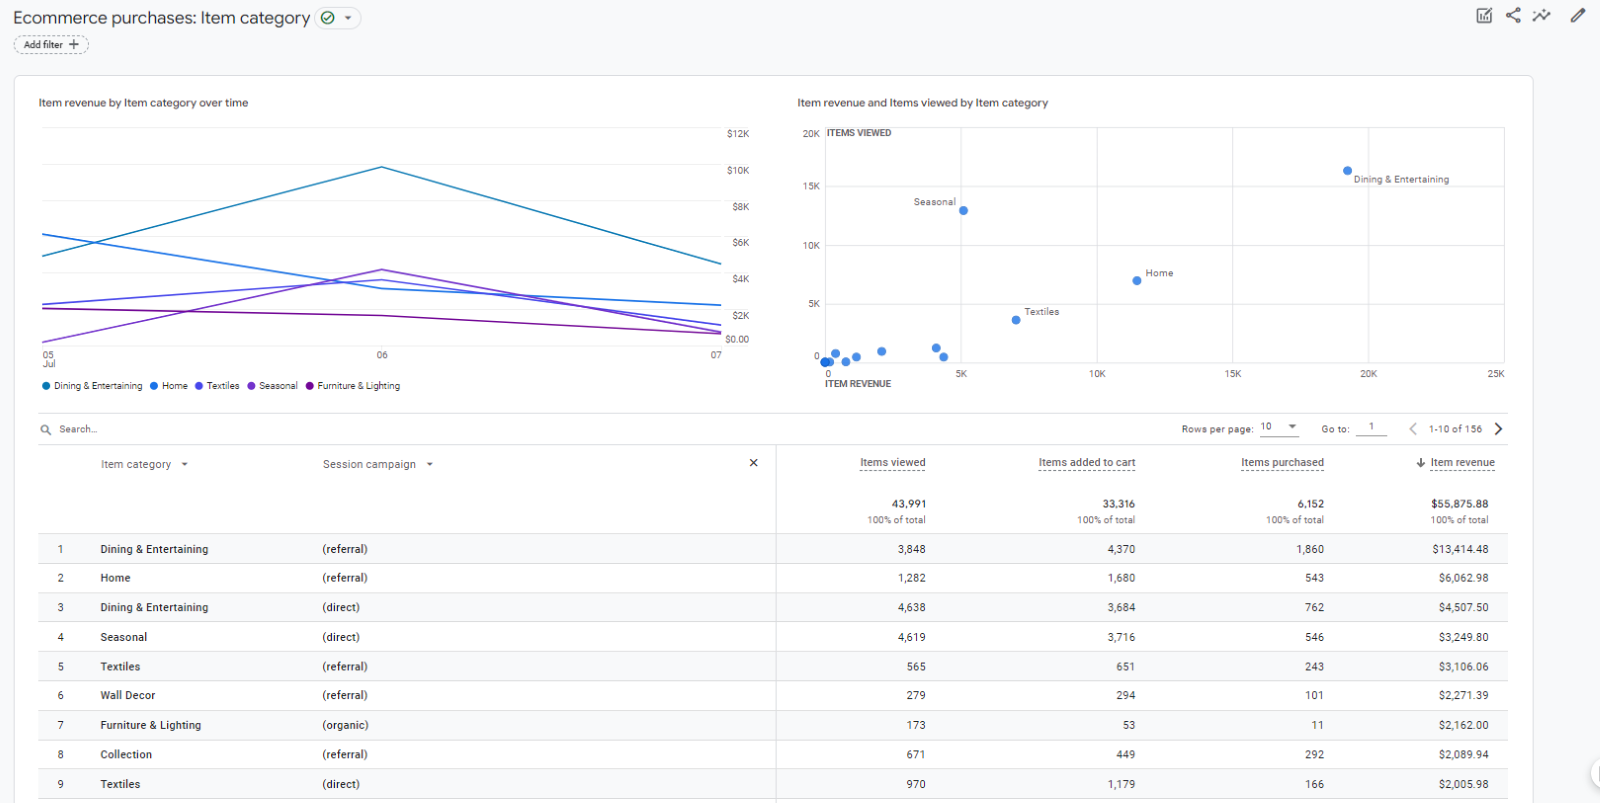
E-commerce Purchases report
The Purchase Report provides a centralized view of your store’s overall sales performance. It’s essentially the starting point for understanding your online revenue and conversions.
This report offers valuable insights into key eCommerce metrics, including:
| Metrics | What it is |
| Item revenue | The total revenue from items only, excluding shipping and tax. (Item revenue = price x quantity) |
| Items added to cart | The number of time an item is added to cart |
| Items purchased | The number of items purchased |
| Items viewed | The number of times an item was viewed |
This comprehensive view empowers you to refine your product lineup amplify sales potential and offers invaluable insights into why certain product categories outperform others. Additionally, the Purchase Report allows you to visualize data over time using line charts or bar graphs, making it easier to identify trends and seasonality patterns in your eCommerce sales.
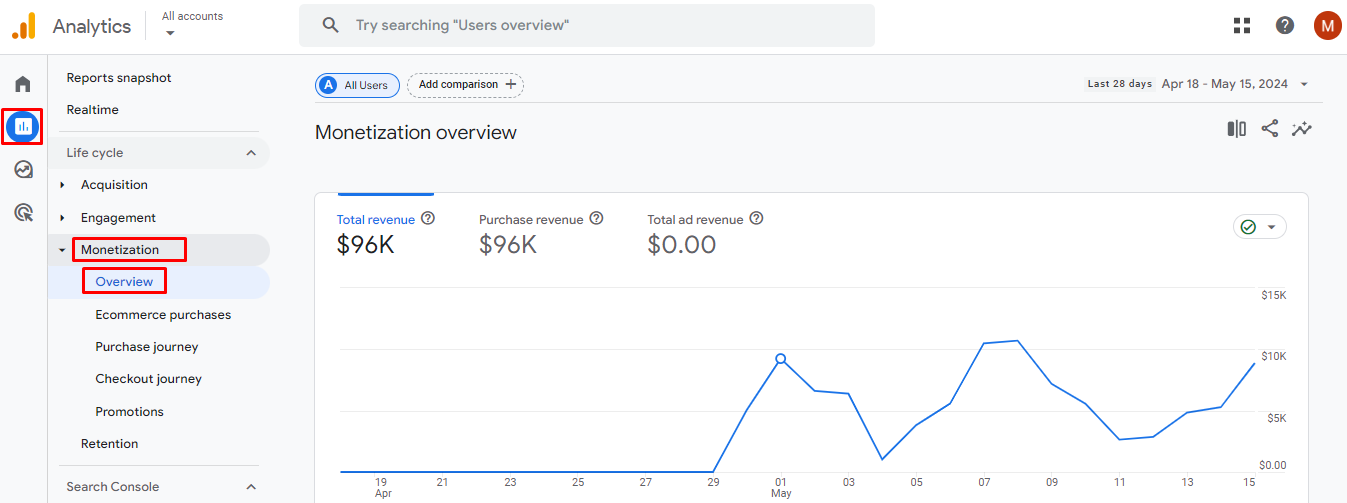
How to see an e-commerce purchases report
- Log in to your GA4 Account.
- Navigate to the Reports section.
- Find and click on the Monetization tab.
- Locate and click on the e-commerce Purchases report.
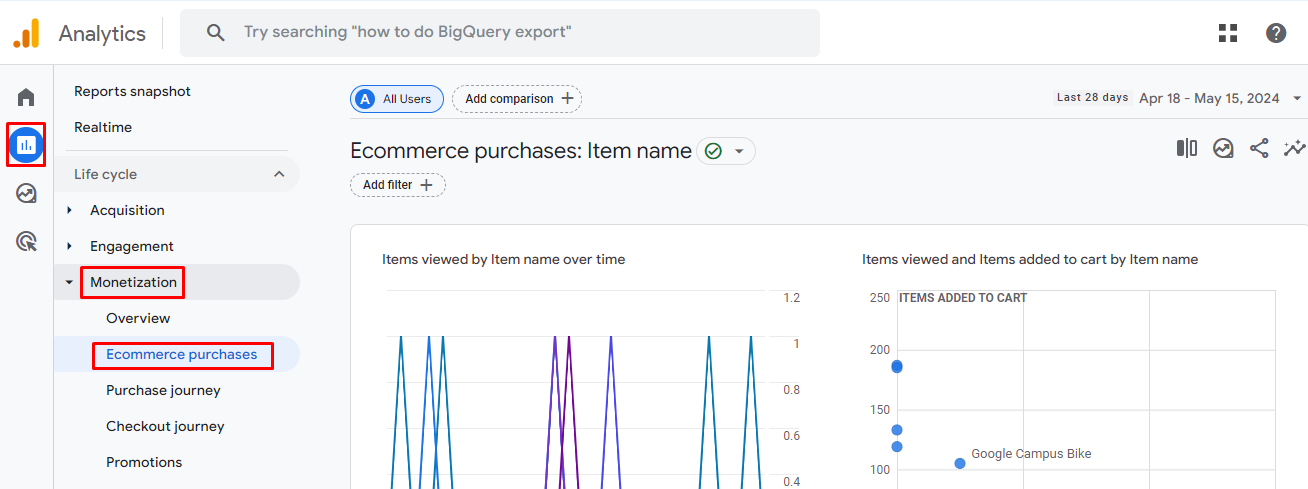
- Customize the report according to your preferences by selecting the desired date range and applying any relevant filters.
- Analyze the data to gain insights into your e-commerce performance. You can track metrics such as total revenue, total purchasers, first-time purchasers, average purchase revenue per user, and more.
- Adjust filters as needed. For example, you can filter the report to analyze the revenue-driving product categories by selecting the Item Category dimension and sorting by revenue.
If you don’t see the E-commerce Purchases report in the left navigation, you can add it if your role in GA4 is either an Editor or Administrator. Follow the instructions provided by Google Analytics to add the e-commerce report to your navigation menu.
Purchase Journey report
Secondly, the Purchase Journey Report provides a comprehensive analysis of the user journey leading to purchase on your e-commerce platform.
This is a vital tool for e-commerce businesses, offering insights into user behavior and identifying potential barriers in the conversion funnel. By visualizing the number of users dropping off between each step of the purchase journey, this report enables businesses to pinpoint areas that require improvement, ultimately enhancing the overall conversion rate.
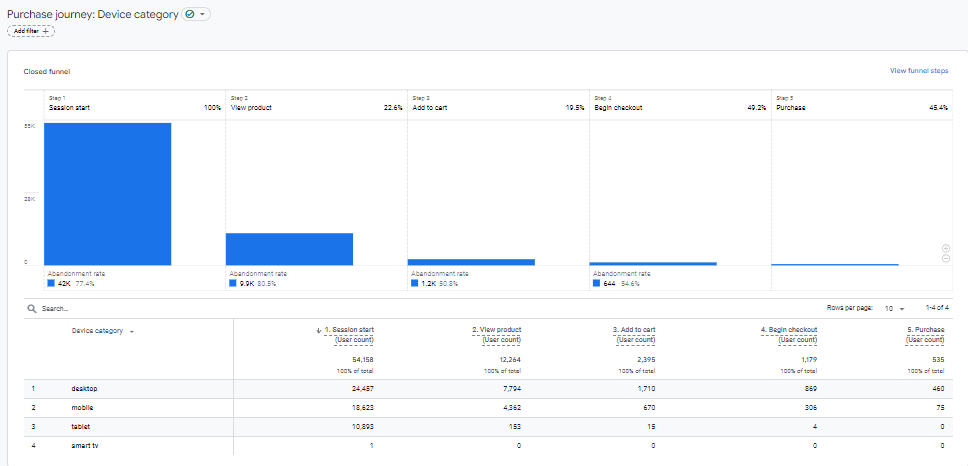
The Purchase Journey Report includes the following metrics:
| Metric | What it is |
| Abandonment rate | The percentage of shopping sessions in which items are added to the cart but the checkout process is not completed. |
| Retention rate | The retention rate represents the percentage of users who transitioned from the previous step. It is displayed in the header of the subsequent step. |
How to see a Purchase Journey report
- First, sign in to your Google Analytics account.
- From the left menu, navigate to the Reports section, then select Monetization.
- Locate and open the Purchase Journey Report.
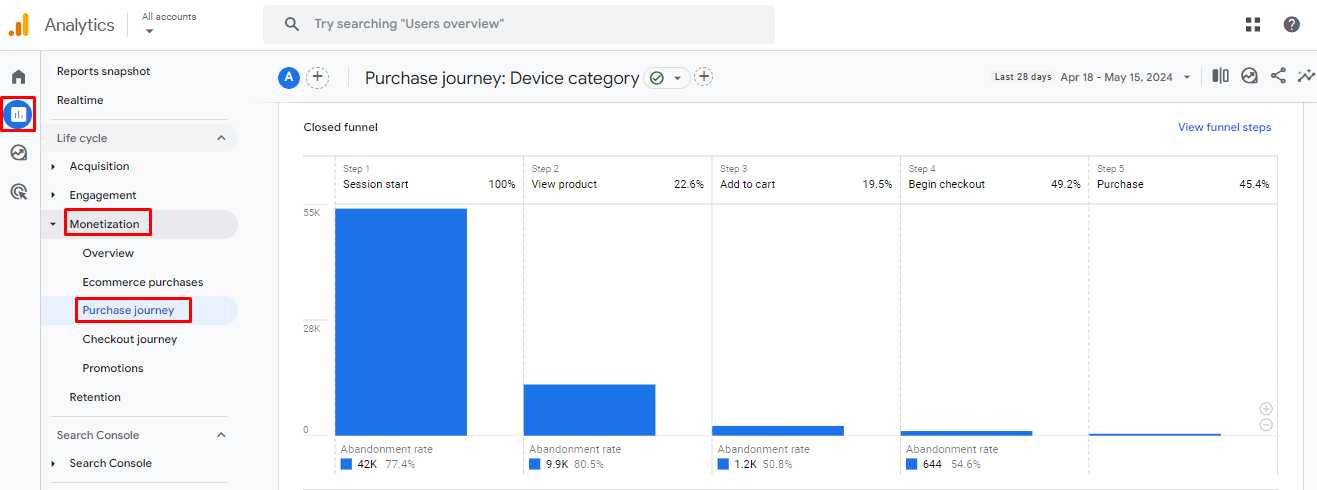
- This report provides insights into the user journey leading to purchase, including drop-off points and potential areas for improvement.
However, if you don’t see the Purchase Journey Report in the left navigation, it may have been removed or is not included in your default set of reports. If you have editor or administrator permissions, you can add the report to the left navigation by customizing your view.
Promotions report
Finally, let’s dive into the Promotions report in GA4 which offers a detailed analysis of the impact of your promotional campaigns on user behavior.
Overview
This comprehensive report empowers you to measure the effectiveness of your marketing strategies and make informed, data-driven decisions to optimize your promotional efforts.
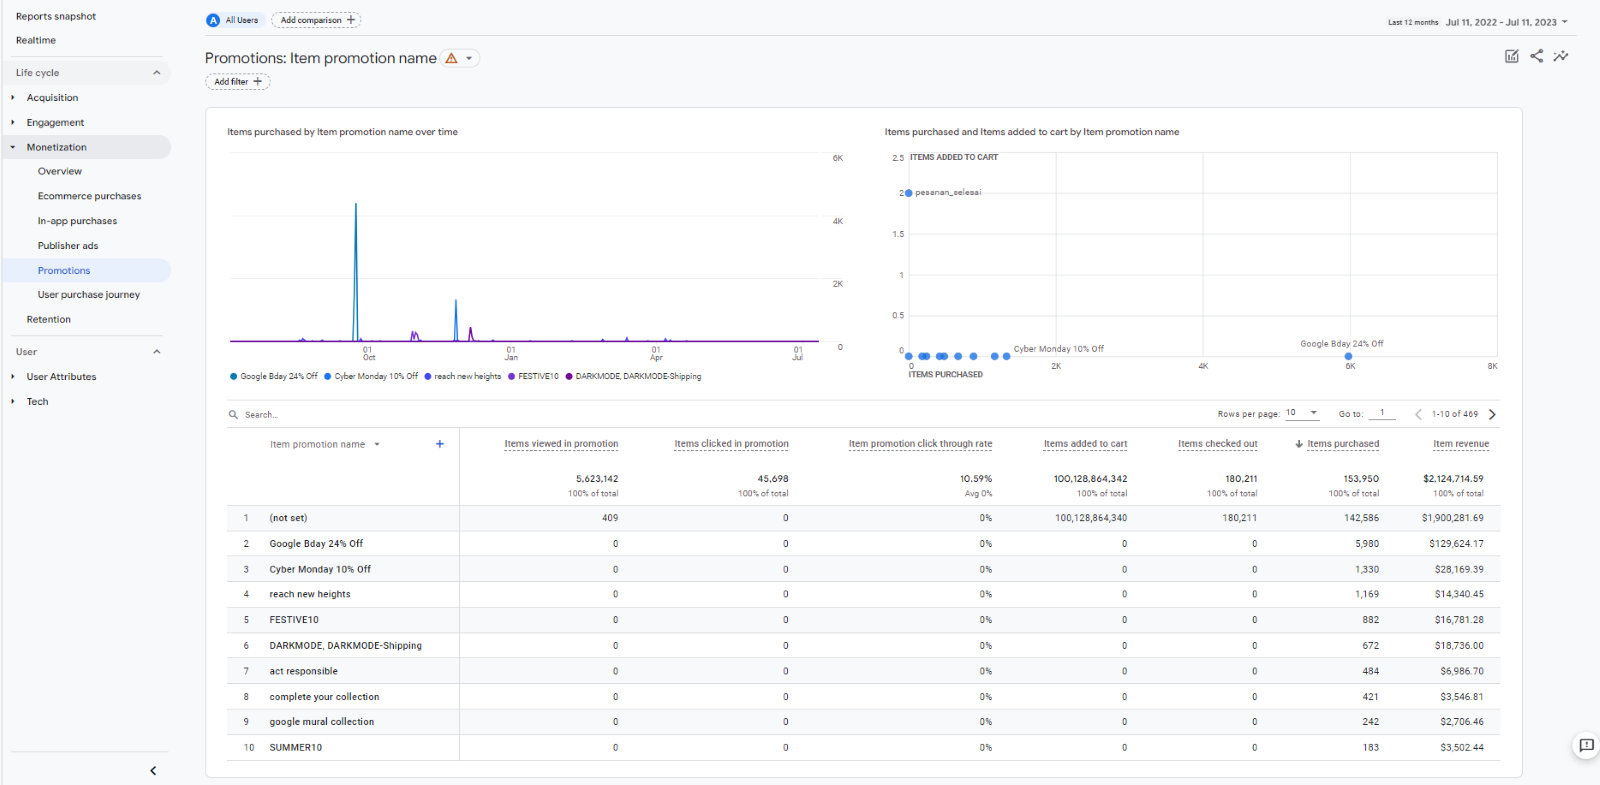
The Promotions Report includes the following metrics:
| Metric | What is it |
| Item promotion click-through rate | This metric calculates the ratio of users who selected a promotion to the number of users who viewed the same promotion. |
| Item revenue | The item revenue represents the total income generated solely from items, excluding taxes and shipping fees. It is calculated by multiplying the price of each item by its quantity. |
| Items added to cart | The number of items placed in the shopping cart |
| Items checked out | The number of items present in the cart during the checkout process. |
| Items clicked in promotion | The number of items clicked within a promotion. |
| Items purchased | The number of items purchased. |
| Items viewed in promotion | The number of time an item is viewed in a promotion. |
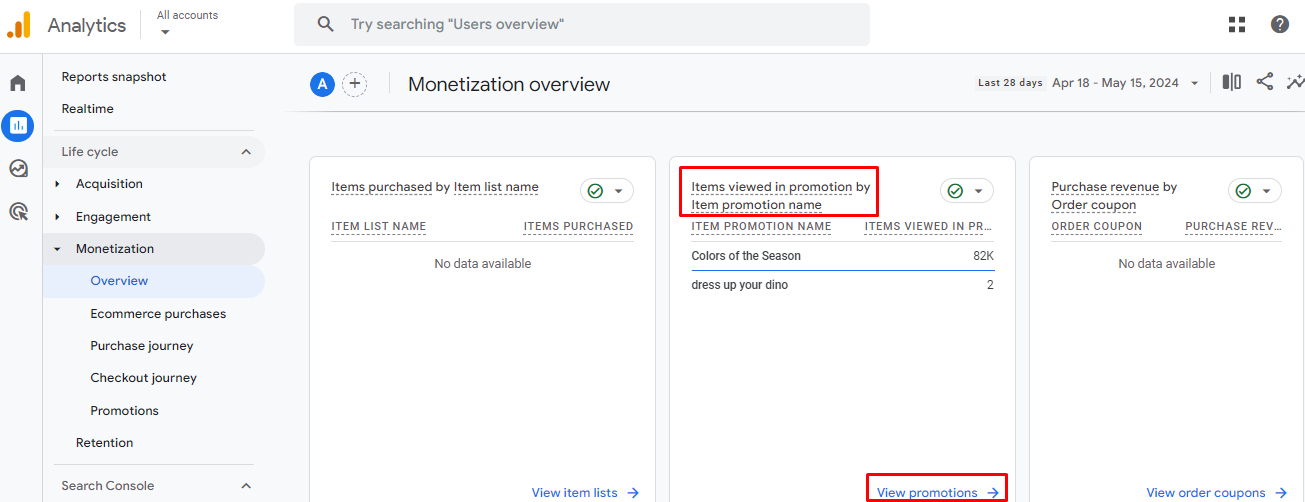
How to see a Promotions report
- Log in to your Google Analytics 4 account and access the reporting interface.
- Select Reports from the left side of the menu to enter the reporting section.
- Click on Monetization located in the left-side menu.
- Choose Overview to access an overview of your e-commerce performance.
- Locate the Items viewed by Item promotion name card.
- Click on View promotions within this card to dive deeper into your promotions data.
Advantages & disadvantages of GA4 e-commerce reports
As you know, GA4 has several advantages and disadvantages for e-commerce reporting, so businesses should carefully consider their specific needs and capabilities before transitioning to the new platform.
Advantages
- Enhanced user journey tracking: GA4 e-commerce reports offer improved user journey tracking, allowing businesses to understand customer behavior across multiple touchpoints and devices.
- Advanced analysis capabilities: GA4 reports provide advanced analysis features such as predictive metrics and machine learning insights, enabling businesses to make data-driven decisions more effectively.
- Cross-platform integration: GA4 integrates seamlessly with other Google tools and platforms, allowing businesses to combine data from multiple sources for a more comprehensive view of their e-commerce performance.
- Customizable reporting: Moreover, GA4 offers customizable reporting options, allowing businesses to tailor reports to their specific needs and objectives.
Disadvantages
- Data processing delay: If you’re planning on using GA4, please note that you may experience delays in data processing. This can occur during high-traffic periods or when the data influx is particularly large. Hence, if you depend on real-time data to make quick adjustments to campaigns, this slight delay can impact decision-making.
- Integration challenges: While GA4 offers cross-platform integration, businesses may encounter challenges when integrating data from third-party platforms or systems that do not natively support GA4.
Solve GA4 report problem with NestAds
While GA4 e-commerce reports offer a robust suite of tools for understanding and optimizing your online business, they also have some limitations.
So to address the challenges businesses may face with GA4 reporting, NestAds offers a tailored solution designed to enhance the effectiveness and efficiency of e-commerce analytics. Our solution offers customizable reporting options tailored to the specific needs of e-commerce businesses. Businesses can generate detailed reports that focus on key performance metrics, allowing for more targeted analysis and actionable insights.
Moreover, with NestAds, you can centralize data from multiple platforms and make data-driven decisions for maximum ROAS. Try a demo today and discover how NestAds can help you drive growth and success for your e-commerce business.