

For Shopify merchants, understanding your store’s performance is crucial for success. One of the most popular tools for doing this is Shopify reports. With numerous metrics available, pinpointing the most relevant ones can be daunting. This blog simplifies that task, offering a focused look at leveraging Shopify reports to enhance your business operations effectively.
In this blog, we’ll explore the essentials of Shopify reports and how you can track and measure overall performance. By the end of this post, you’ll have practical insights to ensure your decisions are data-driven and impactful on your store’s growth.
An overview of Shopify reports
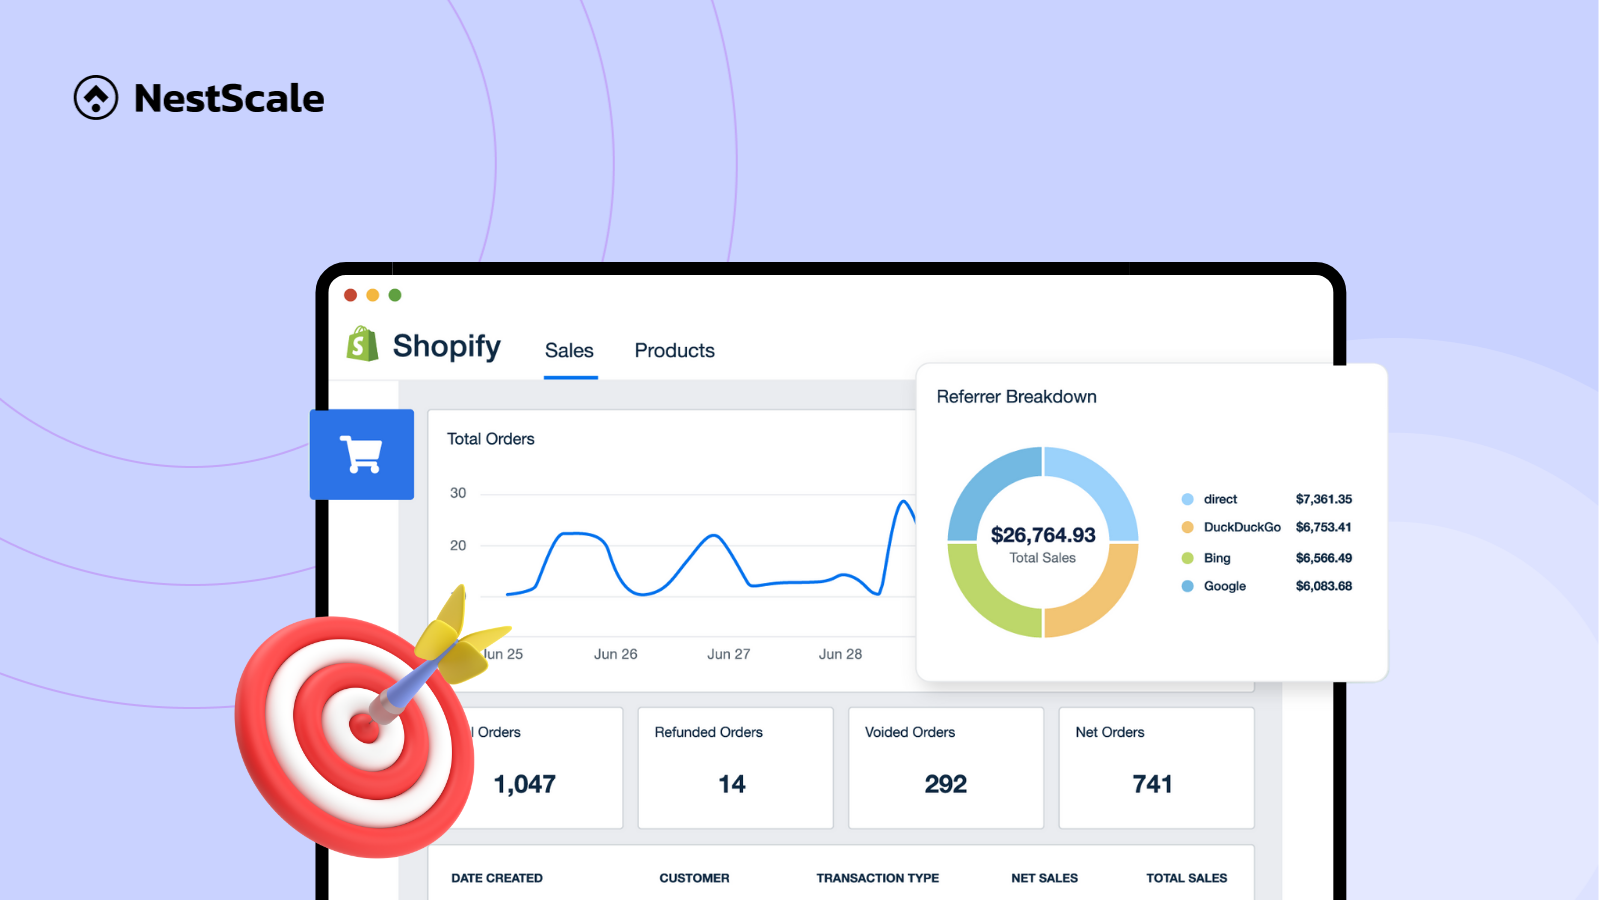
Shopify Analytics reports offer a dynamic way to visualize your store’s data through both graphs and tables. These reports are divided by the Shopify metrics they provide, allowing you to access different reports based on your needs.
Currently, all reports are available to merchants on any pricing plan. However, if you’re on the Advanced plan or higher, you can also save your customized reports for easy access later.
Understanding and utilizing Shopify reports is fundamental for merchants operating on Shopify. These tools are designed to help you gain understanding of your store’s operations and customer behaviors, enabling you to make informed decisions that enhance efficiency and effectiveness.
Where to find Shopify reports?
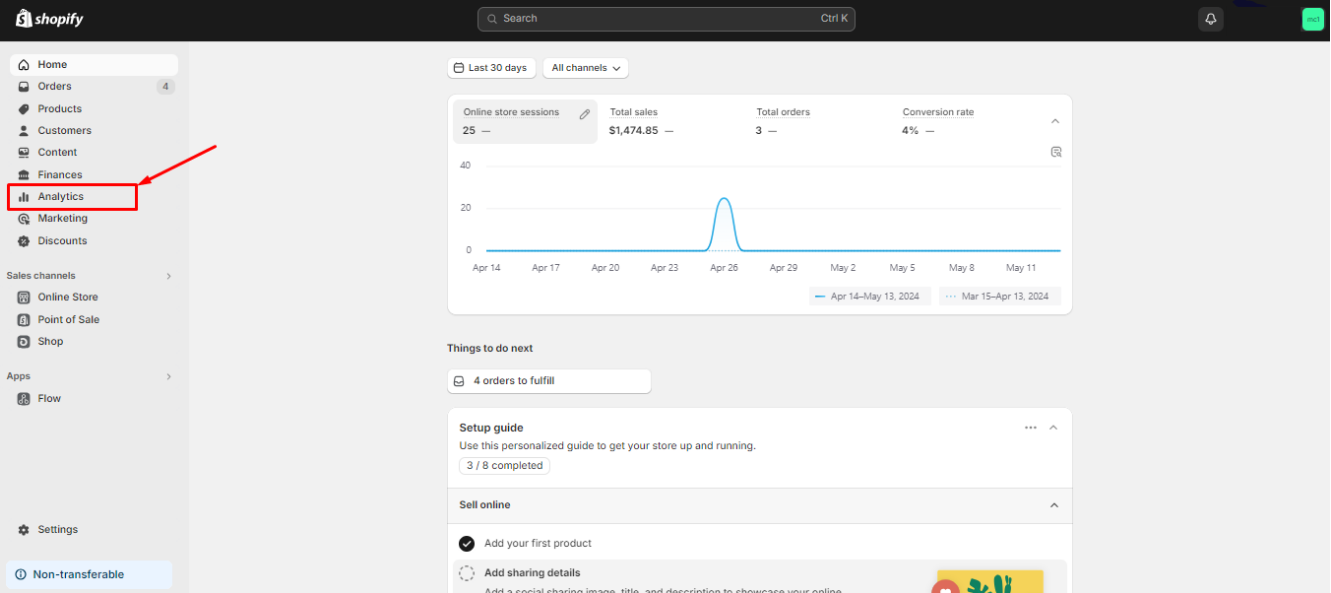
Shopify reports are a key feature within Shopify. To access your Shopify reports, navigate to your store admin dashboard. Click on Analytics.
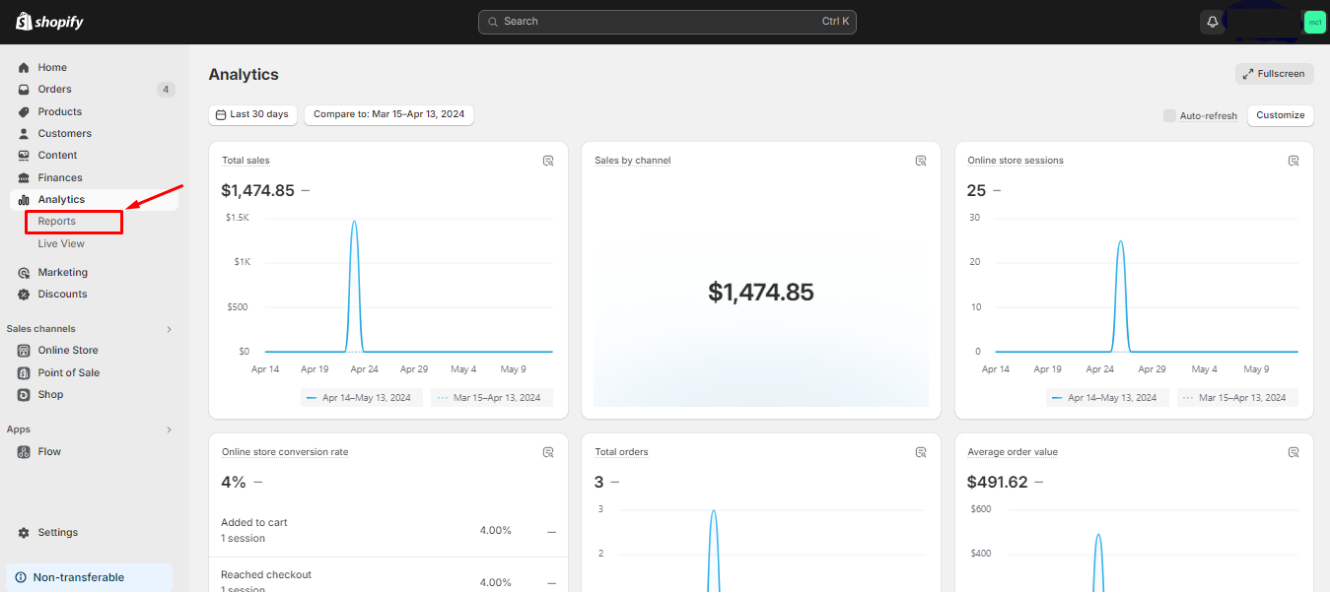
Then, go to Reports
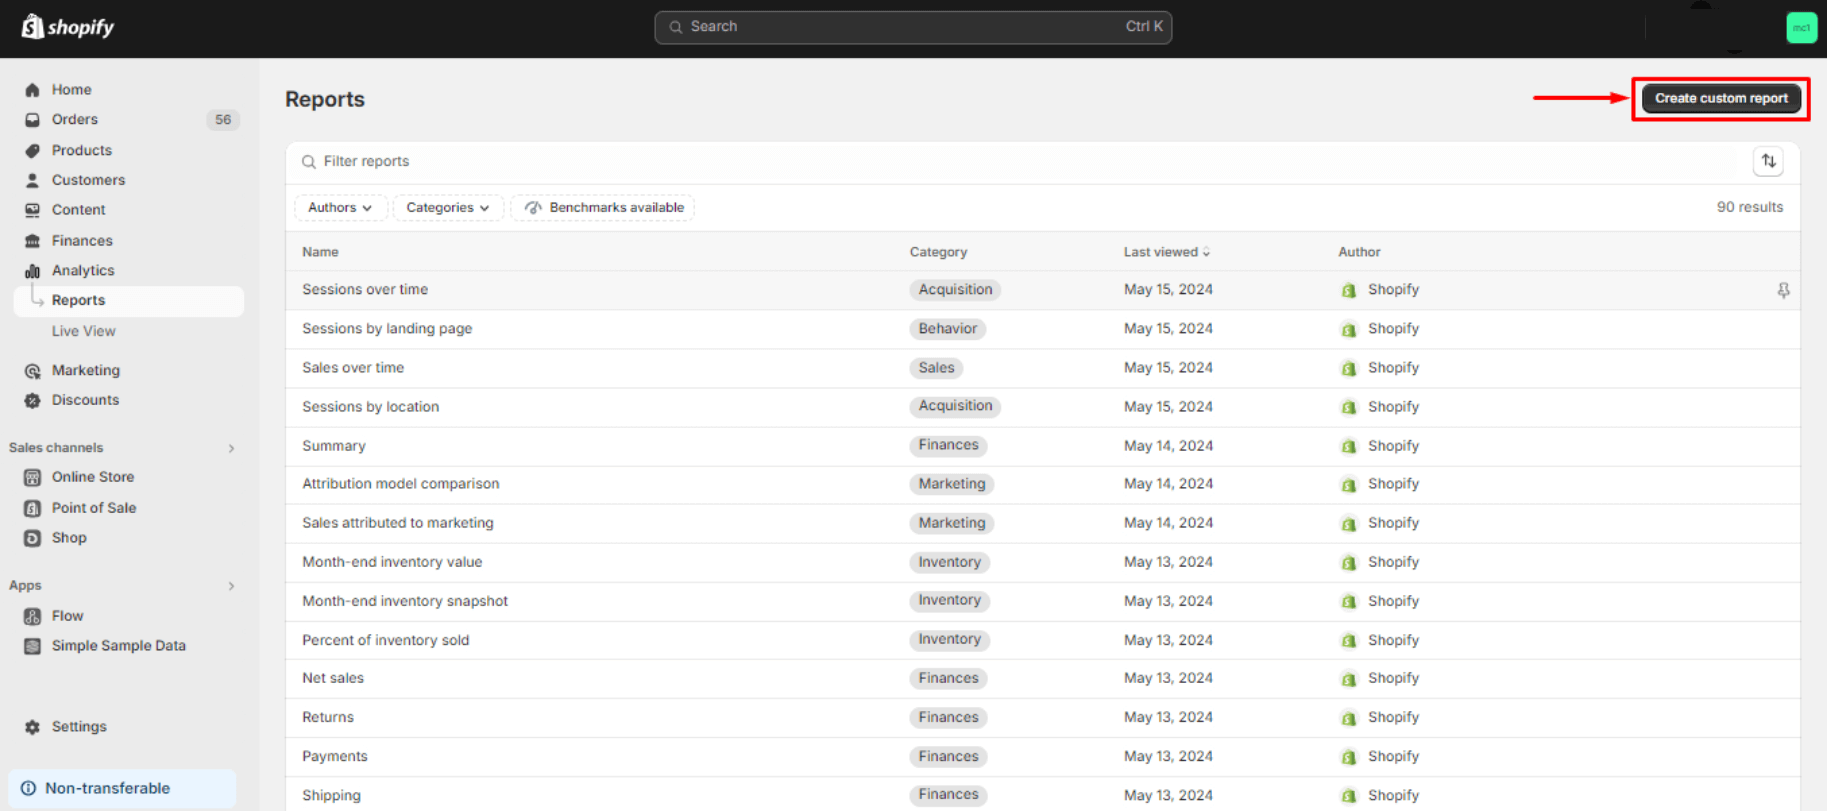
Once you’re in the Reports section, you can view all your available reports. To find the specific reports you need, click on Categories to filter them.
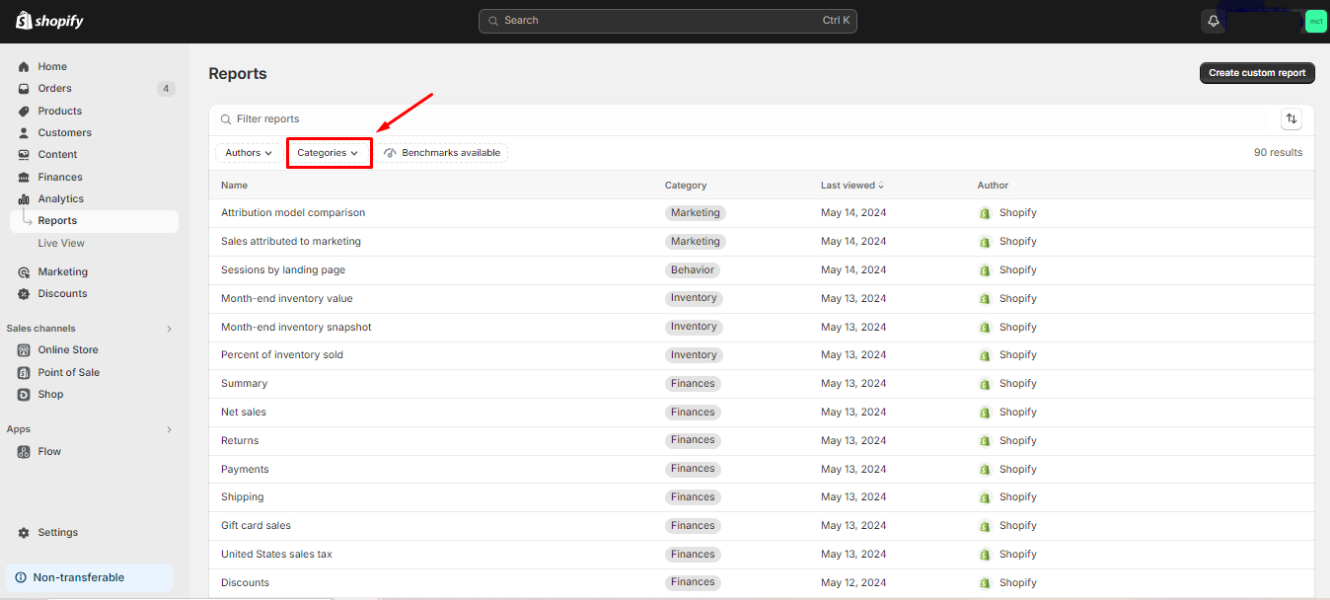
After filtering into main categories, it’ll be easier for you to find and analyze the data you’re looking for. You can also use the research box to find the report of your need.
Types of Shopify reports you must know
Shopify categorizes its reports based on the type of information it provides. This makes it easy to navigate and find the specific data. Depending on your subscription plan, different reports will be available to you, offering insights tailored to your business needs.
Finance reports
The Financial reports offers a diverse array of reports, with 19 different options available for you to explore. That’s quite a few, isn’t it? However, when you navigate to this section, we recommend focusing primarily on one key report: the Summary report.
This Summary view provides a quick snapshot of 4 financial aspects of your store: sales, liabilities, payments, and gross profit. It effectively covers the essentials of the other 18 finance reports.
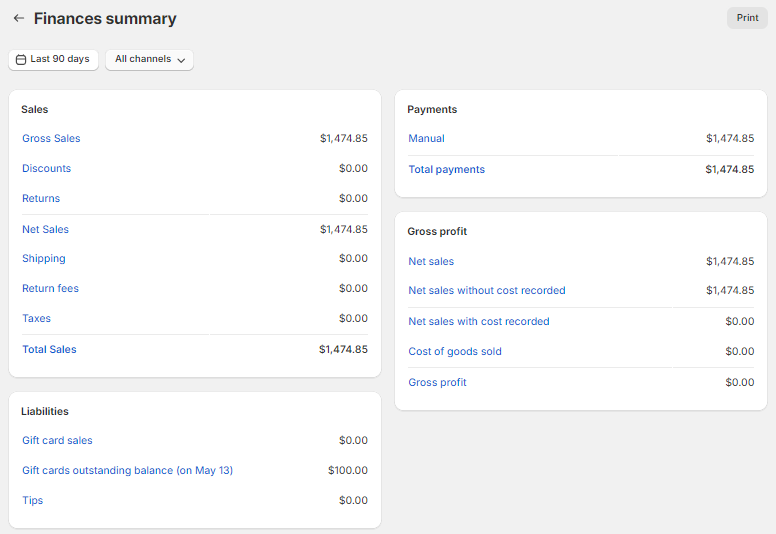
- Sales overview: This section gives you an overview and direct links to more detailed reports, helping you dissect each aspect of your sales metrics. This includes gross sales, discounts, returns, net sales, shipping, and taxes.
- Liabilities overview: Managing liabilities efficiently is crucial for maintaining healthy cash flow and ensuring customer satisfaction. The Liabilities section in Shopify focuses on elements like gift cards and tips.
- Payment overview: The Payments section offers a summarized view of how your customers are settling their invoices, providing insight into the cash flow from sales.
- Gross profit overview: The Gross profit section breaks down your profits in relation to costs and net sales, offering a clear view of your financial health.
By concentrating on these key areas, you can gain valuable insights into your store’s financial without getting overwhelmed by the sheer number of reports available.
Acquisition reports
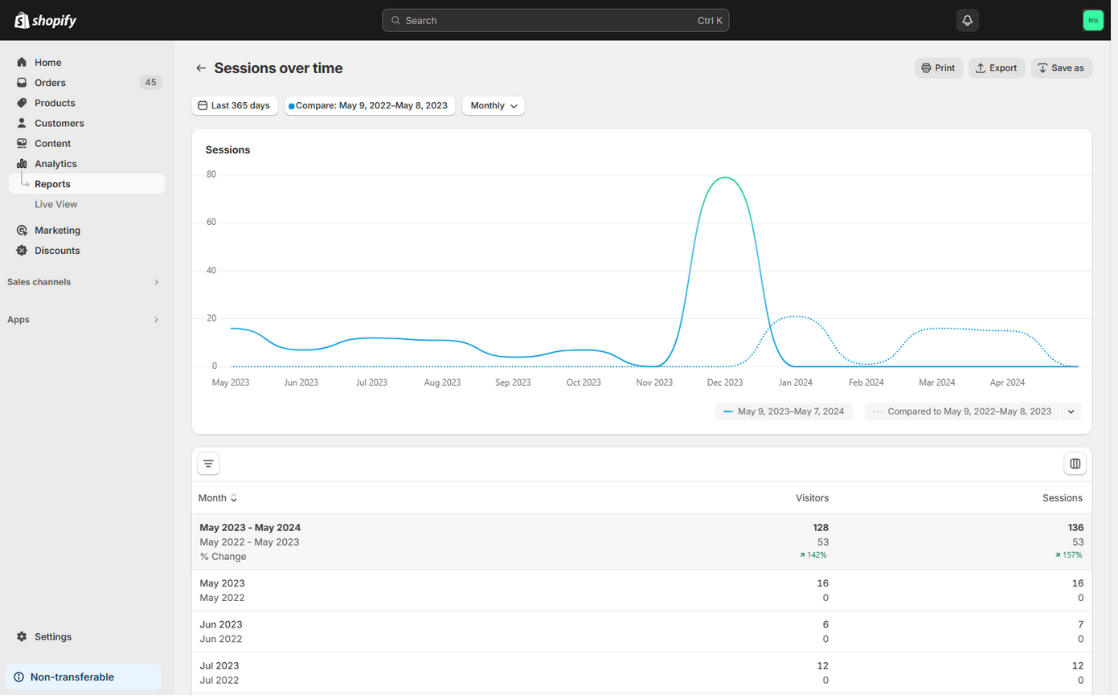
Moving to acquisition reports, you will find comprehensive information relating to the visitors who come to your store. This includes the number of visitors and the number of sessions within your store. Shopify counts a session as starting when your customers visit your store and ending when your customers either leave or remain inactive for 30 minutes, or at midnight UTC. As one visitor can do multiple sessions within your store, the number of sessions is usually higher than the number of visitors.
Sessions in Shopify are tracked using cookies. This method is straightforward for tracking sessions and customer visits. However, tracking with cookies has limitations. If your customers use ad blockers or don’t accept cookies, their actions won’t be counted. This will eventually affect the accuracy of your data.
Acquisition reports give you insights into 3 metrics:
- Sessions over time: Tracks the number of visitors over specified periods.
- Sessions by referrer: Shows how visitors arrive at your store, whether through direct visits, search engines, or referral links.
- Sessions by location: Provides geographic data on where your store’s visitors are coming from.
Behavior reports
Shopify behavior reports will provide you insights into how users interact with your website or online store. These reports track and analyze user activities, such as how visitors navigate through your site, the pages they spend the most time on, and where they tend to drop off. By understanding these behaviors, you can gain valuable insights into user preferences and pain points.
Here are some key reports you should track to gain insights into your online store’s performance:
- Web performance: This report analyzes your store’s website speed and technical performance, including interactivity and visual stability.
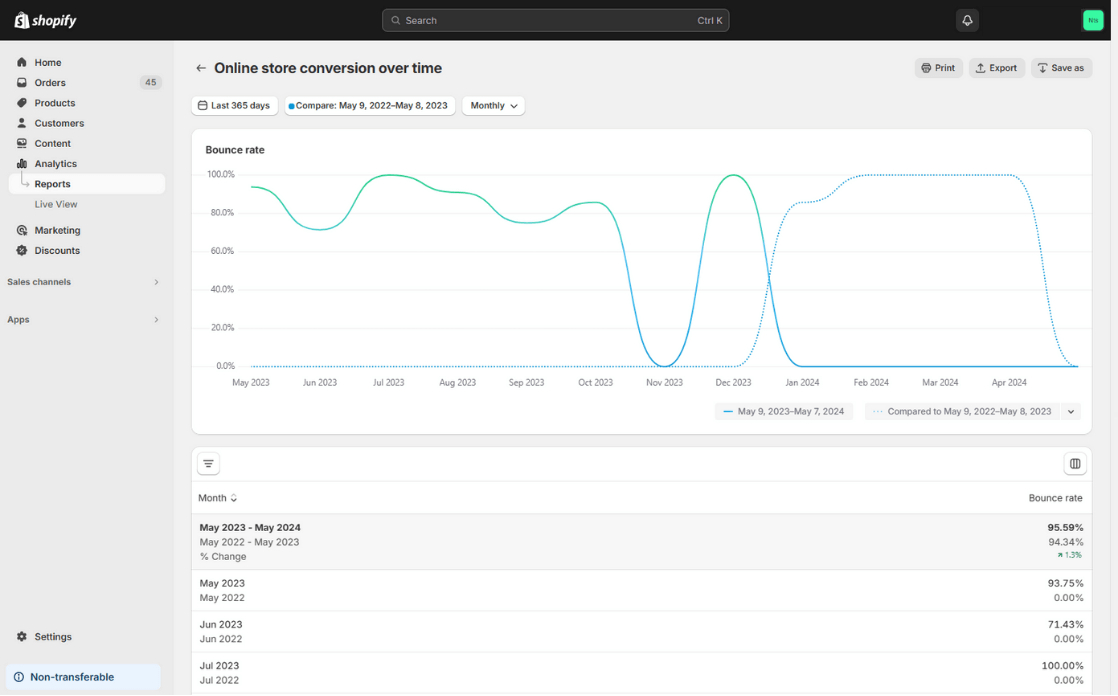
- Online store conversion over time: This report shows the percentage of online store visitors who make a purchase during a selected time period. Additionally, it provides the number of sessions customers have in your online store and the actions they take, such as adding items to the cart and checking out.
- Top online store searches: This report reveals the terms customers use to search within your store and the number of sessions where customers searched your store with those terms.
- Online store cart analysis: Lastly, the Online store cart analysis helps you see which products customers frequently add to their cart. With this, you can discover excellent ideas for product bundles and identify upselling opportunities.
Customer reports
Customer reports in Shopify are designed to provide a comprehensive view of your customer interactions. These reports track various metrics such as average order count, total purchases, and predicted future spending.
By analyzing these metrics, you can gain a deep understanding of your customers’ buying patterns and preferences. This information is crucial for creating targeted marketing campaigns and personalized shopping experiences.
Here are some key customer reports you should monitor closely:
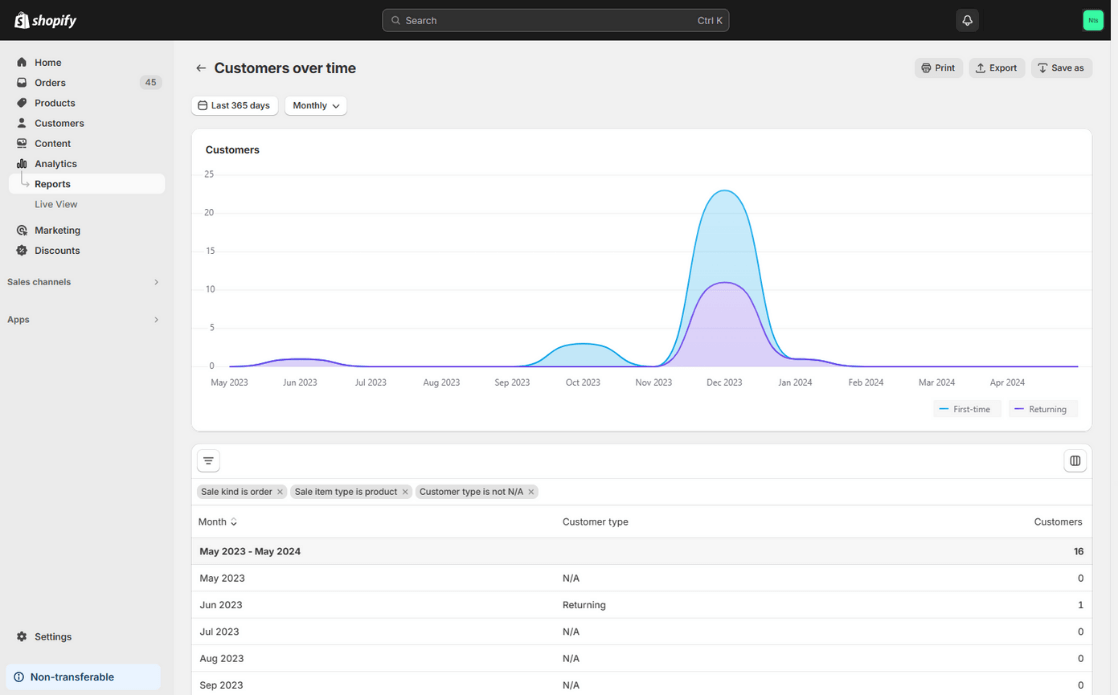
- Customers over time: This report shows the number of customers who have placed orders in your store over a specific period. It helps you understand customer acquisition trends.
- Returning customers: This report tracks the behavior of customers who have made two or more purchases. It is vital for understanding customer loyalty and repeat business.
- One-time customers: This report displays the number of customers who have only made a single purchase. While it might seem less important, this data is crucial for tailoring engaging activities to encourage their return.
- Customer cohort analysis: This report groups customers based on the date of their first purchase, allowing you to track and analyze their behavior over time. It is particularly useful for identifying your most valuable customers.
Inventory reports
Shopify’s inventory reports offer a detailed view of your stock levels, sales velocity, and product performance. With this information, you can gain insights into your sales patterns and customer product demand. You’ll see which products are popular and should be emphasized to optimize your store’s inventory levels.
A little note is that it can take 12 – 72 hours for inventory levels to update in the reports. Hence, you should wait for at least 1 day to access the most accurate information.
Currently, Shopify offers 7 inventory reports, including the month-end inventory snapshot, ABC analysis by product, average inventory sold per day, days of inventory remaining, month-end inventory value, percentage of inventory sold, and sell-through rate by product. However, to avoid confusion while still gaining a comprehensive overview of your inventory status, we recommend focusing on just three main reports:
- Month-end inventory snapshot: Shows the remaining quantity of each product variant at the end of the month.
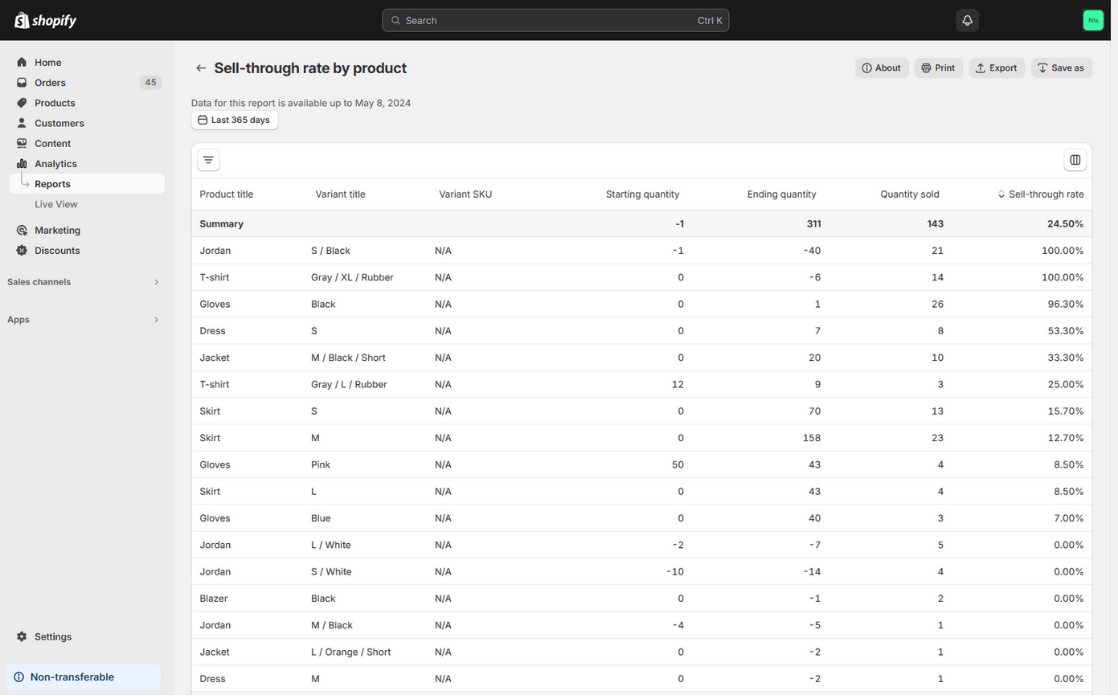
- Sell-through rate by product: Measures the percentage of inventory sold during a selected period. High sell-through rates suggest a well-matched supply and demand, while low rates may indicate overstocking or misaligned pricing strategies.
- Percent of inventory sold: Provides insights into the proportion of stock sold for each product variant over a customizable period.
- ABC analysis by product: This strategic report grades your products based on the revenue contribution of each variant over the last 28 days. Monitoring this report helps focus your resources on high-impact products, enhancing profitability.
- Days of inventory remaining: Estimates how long your current stock will last based on historical sales data. This forecast assists in planning restocks and can help avoid potential sales losses due to inventory shortages.
Marketing reports
Shopify’s marketing reports provide insights into which marketing efforts are driving the most traffic, conversions, and sales value across different channels.
Shopify offers a variety of marketing reports, covering everything from sales value and number of impressions to sessions and conversions attributed to each marketing channel. However, for those new to Shopify reports and to avoid confusion, we recommend starting with two key overview reports:
- Sales attributed to marketing: This report quantifies the direct results of your marketing efforts on sales, allowing you to see exactly how much revenue each campaign has generated.
- Attribution model comparison: This report compares the effectiveness of different attribution models, such as first or last interaction. It helps you understand which model best represents the impact of your marketing on sales.
One limitation of Shopify’s marketing reports is that they only provide two views of attribution models: the last and first interaction. This can limit the depth of analysis, potentially oversimplifying the attribution of each channel and obscuring the full customer journey.
Additionally, please note that the data reported can take up to 24 hours to generate. Therefore, you’ll have to wait at least a day after your campaign ends to generate an accurate report.
Profit margin reports
Profit reports provide essential insights into the costs, margins, and overall profitability of your online store. To maximize the usefulness of your these reports, ensure that a cost is added to each of your products. This lets you see the precise flow of money into and out of your business, which is crucial for effective accounting.
Shopify offers several types of profit reports that merchants can utilize:
- Profit by product: This report displays the total profit for each product within a selected timeframe, helping you understand which items are your most profitable.
- Profit by product variant SKU: Shows the profit for specific product variants over a chosen period. This detail allows you to pinpoint which versions of a product are performing best.
- Profit by point of sale location: Provides the gross profit for each point-of-sale location. This is especially useful for retail merchants operating multiple physical stores, as it helps identify which locations are contributing most to the bottom line.
Sales report
Shopify’s sales reports provide detailed information about your customers’ orders based on various criteria, such as product type or sales channel. This feature makes them essential for accurately tracking the value of your sales over extended periods.
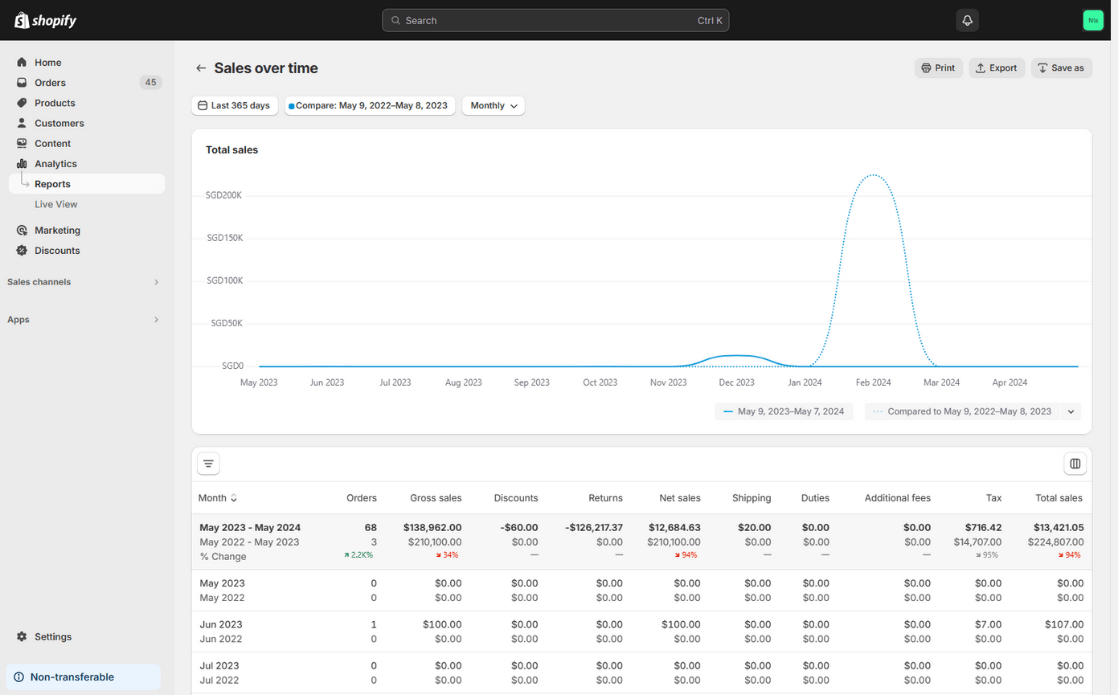
Some main views of Sales reports that you should keep a close eye on are:
- Sales over time: This report shows the number and total value of orders over a specific period, giving you insight into sales trends and cycles.
- Sales by channel: This report groups sales by their origin, such as Facebook, point of sale (POS), or your online store, helping you understand which channels are most effective.
- Average order value over time: Tracks changes in the average order value, which can inform strategies for increasing customer spend.
Order reports
Order reports are invaluable tools that provide insights into your order volume, shipping times, and returns, helping you understand more about your store’s operational dynamics. These reports can pinpoint which products are your best-sellers and which ones are returned most frequently.
Understanding customer satisfaction and identifying potential issues with merchandise are two significant benefits of order reports. For instance, if a product is being returned more often than others, this could indicate a problem with its design or quality.
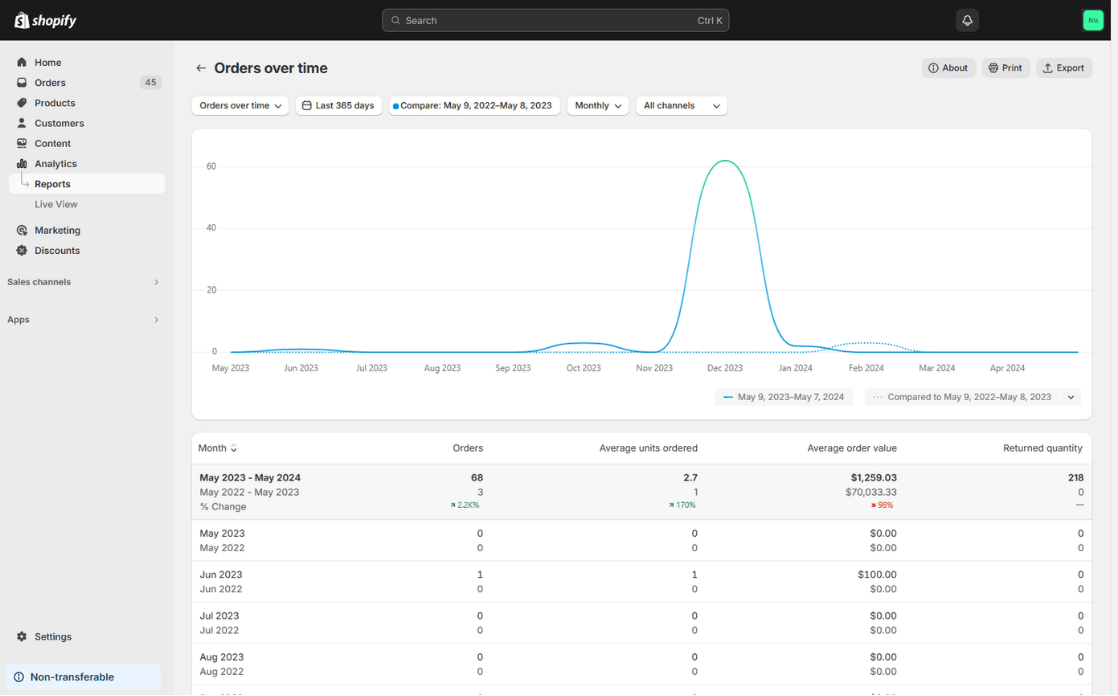
Here are some key order reports you can generate to better manage your store:
- Orders over time: Track the number of orders fulfilled within a specific timeframe.
- Fulfillment, shipping, and delivery times: Monitor the duration from when an order is placed to when it is delivered. This report helps assess the efficiency of your fulfillment process.
- Fulfillment over time: Review the total number of orders that have been fulfilled, shipped, or delivered over a chosen period.
- Product orders and returns: Gain insights into the performance of specific products in terms of sales and returns.
- Shipping labels over time: Analyze trends in the creation of shipping labels, which can help streamline your shipping processes.
Custom reports
Custom reports allow Shopify merchants to tailor the default reports by using filtering and editing tools. This customization can reveal unique insights and enhance decision-making.
For instance, you just launched a marketing campaign to introduce a new product, utilizing platforms like Facebook or Google Ads. While a standard report shows sales attributed to marketing efforts as a whole, custom reports enable you to delve deeper. You can analyze sessions, leads, and sales from each specific channel, providing a clearer picture of which platform contributed most effectively to your campaign.
To access Custom reports in your Shopify store, you must be subscribed to the Advanced plan or higher. If you’re on one of these plans, simply go to the reports section and click on Create custom report. Shopify enables you to customize your report according to your specific needs and preferences.
Tips to optimize the insights from Shopify reports
We’ve just guided you through some of the most important reports for monitoring essential e-commerce insights. By applying the right analysis techniques, we’re confident that you can gain practical insights to immediately enhance your store’s performance. In this final section, let us share 3 tips that can help you generate actionable insights from your Shopify reports:
Set clear objectives before you analyze
Before diving into Shopify analytics, it’s crucial to set specific goals for what you hope to achieve with your analysis. This approach ensures that your efforts are focused and productive.
For instance, if your objective is to increase conversion rates, you’ll specifically look at data points related to customer interactions with product pages and the checkout process. If improving customer retention is your goal, you’ll focus on analyzing purchase patterns and customer feedback.
Setting these goals not only helps narrow down the data for reviewing but also directs your strategies. This targeted analysis makes your efforts more efficient and effective, allowing you to quickly identify opportunities for improvement and make informed decisions that directly impact your store’s performance.
Plan out customer flow before delving into the data
To effectively prioritize your analysis of Shopify reports, we recommend you analyze your sales funnel by mapping out each stage from the homepage to checkout. By understanding the flow and identifying where you lose most of your visitors, you can pinpoint critical areas for optimization.
For instance, if you notice a significant drop in visitors to the checkout page, that’s an indication to delve deeper into potential issues at that stage. Remember, improvements at the lower end of the funnel can yield disproportionately high returns, making these areas particularly valuable for increasing overall conversion rates.
Integrate your marketing data for a comprehensive view
To give you a comprehensive view of the performance of all channels you’re running, we recommend integrating your Shopify store data with marketing analytics, like advertising data. This approach allows you to see how various campaigns affect customer behavior and sales. For example, tracking conversion rates can help you measure the effectiveness of specific promotions or ads in converting visitors to buyers. This data-driven strategy ensures that marketing resources are directed toward the most profitable tactics, thereby enhancing your marketing efforts.
Shopify Analytics enables you to merge your campaign data with your store’s reports, providing a broad overview of metrics related to your orders and their values. However, if you’re looking to dive deeper into data, such as CPA, ad spend, or ROAS, you may need additional support to gain a comprehensive insight.
Consider trying NestAds—our ad tracking and marketing attribution tool tailored exclusively for Shopify merchants. With NestAds, you can directly access benefits tailored for Shopify reports, such as viewing customer orders and their values, along with detailed marketing metrics like CPA, conversion rate, ROAS, and CTR. It’s user-friendly and perfectly suited as a supportive tool for monitoring the marketing performance of your store.