

In today’s rapidly evolving e-commerce landscape, Shopify has become a central platform for merchants aiming to grow their online stores. With such a wealth of data available, understanding the key performance indicators (KPIs) and metrics that Shopify provides is essential. These metrics not only shed light on your store’s performance but also guide strategic decisions to enhance your business operations. This blog explores the essential Shopify metrics you should track, how to customize your Shopify reports and the advantages and disadvantages of monitoring metrics within Shopify Analytics.
What are the metrics Shopify is providing?
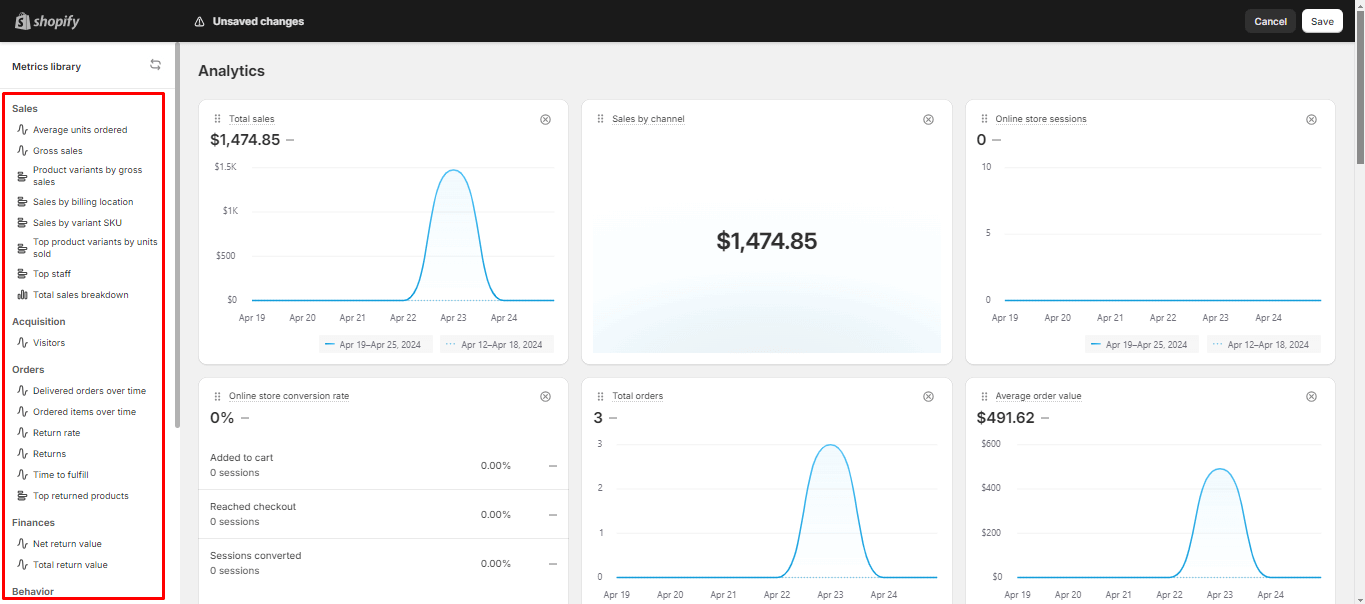
Shopify offers all its users a dedicated section called Shopify Analytics, which is essential for tracking and analyzing your e-commerce metrics when selling on Shopify. By examining the metrics provided within Shopify Analytics, you can gain a comprehensive overview of your store’s activity, web performance, transaction details, and inventory.
Currently, Shopify Analytics features a total of 48 metrics and report dimensions, categorized into 8 main groups: Sales, Acquisition, Order, Finances, Behavior, Customers, Inventory, and Marketing.
Although there are many metrics available, it can be overwhelming and impractical to analyze all of them. Among the numerous metrics provided by Shopify, there are key ones that you should focus on for your reports. These essential metrics offer the most crucial insights into how your store is performing. In the next section of this blog, we will provide you with some key metrics to consider.
9 important Shopify metrics & KPIs you should track
Understanding and tracking the right KPIs is crucial for any Shopify store owner. So now. Let us run you through 9 metrics within Shopify Analytics that we think you should focus on more:
Total sales
Total sales is a foundational metric that tracks the total revenue generated by your store over a specific period. It’s crucial for monitoring overall business health and trend patterns.
By comparing current sales to past performance, you can identify peak periods, assess the effectiveness of promotions, and gauge overall growth. This metric offers a snapshot of financial performance, guiding strategic decisions such as inventory planning and promotional campaigns.
Total orders
This metric counts all completed purchases over a designated time frame. It’s vital for understanding sales volume independent of revenue figures.
Tracking total orders helps you identify trends in order volume, understand the impact of marketing strategies, and forecast future inventory needs. By comparing current order volumes with historical data, you can pinpoint growth trends and evaluate the effectiveness of your marketing efforts.
Return rate
The return rate is calculated by dividing the number of returns by the number of sales. This metric shows the percentage of sold items that customers have returned, and it’s crucial for assessing customer satisfaction with your products.
Monitoring this metric in your Shopify store helps you address potential issues before they escalate, ensuring customer satisfaction and loyalty. Generally, a lower return rate is better. However, acceptable rates can vary by industry; typically, around 15% is considered acceptable. Therefore, you should closely monitor your product quality and act promptly if the return rate becomes too high.
Visitors
The visitor metric provides insights into your store’s traffic, tracking how many people visit your online store over a certain period. This acquisition metric is crucial for evaluating your store’s reach and the effectiveness of your marketing strategies in driving traffic.

When monitoring this metric, closely observe the trends of traffic fluctuations over time. Generally, for e-commerce, monthly traffic growth of around 10-20% can ensure a steady stream of conversions and sales.
Average order value
AOV measures the average amount spent per transaction and is a key metric for understanding customer purchasing behavior. It’s instrumental in strategizing upselling and cross-selling techniques.
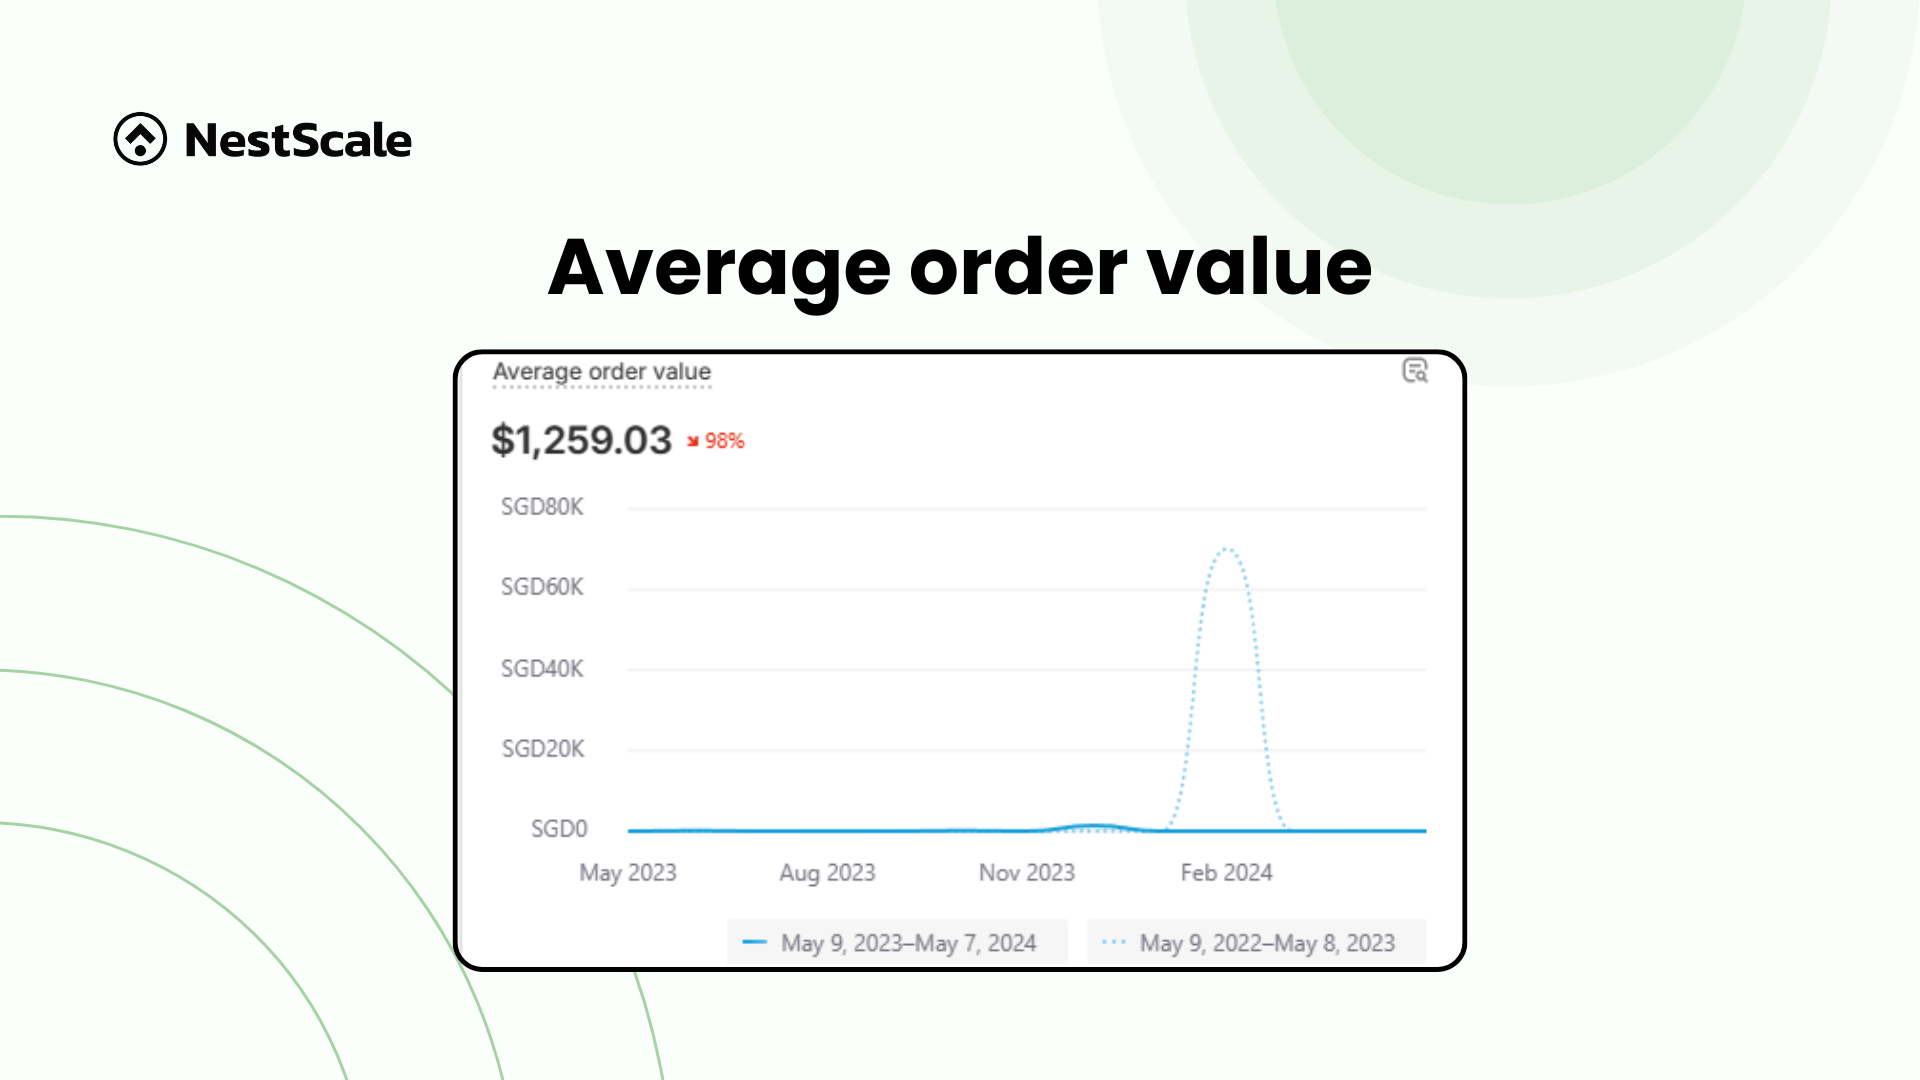
By tracking AOV, you can gauge the success of your pricing strategies and promotions, aiming to increase the overall revenue per customer.
Bounce rate
One metric that offers insights into customer behavior and your website’s performance is the bounce rate. This metric represents the percentage of visitors who leave your site after viewing only one page. It’s crucial for assessing the effectiveness of your site’s landing pages and initial customer engagement. A high bounce rate might suggest that your site isn’t immediately engaging or doesn’t meet visitors’ expectations.

An acceptable bounce rate varies greatly depending on your industry and the products you sell. However, a general benchmark to keep in mind is around 20% to 45%. If this rate becomes too high, it’s advisable to review your site to identify any issues or check whether the UX design aligns with your customers’ needs.
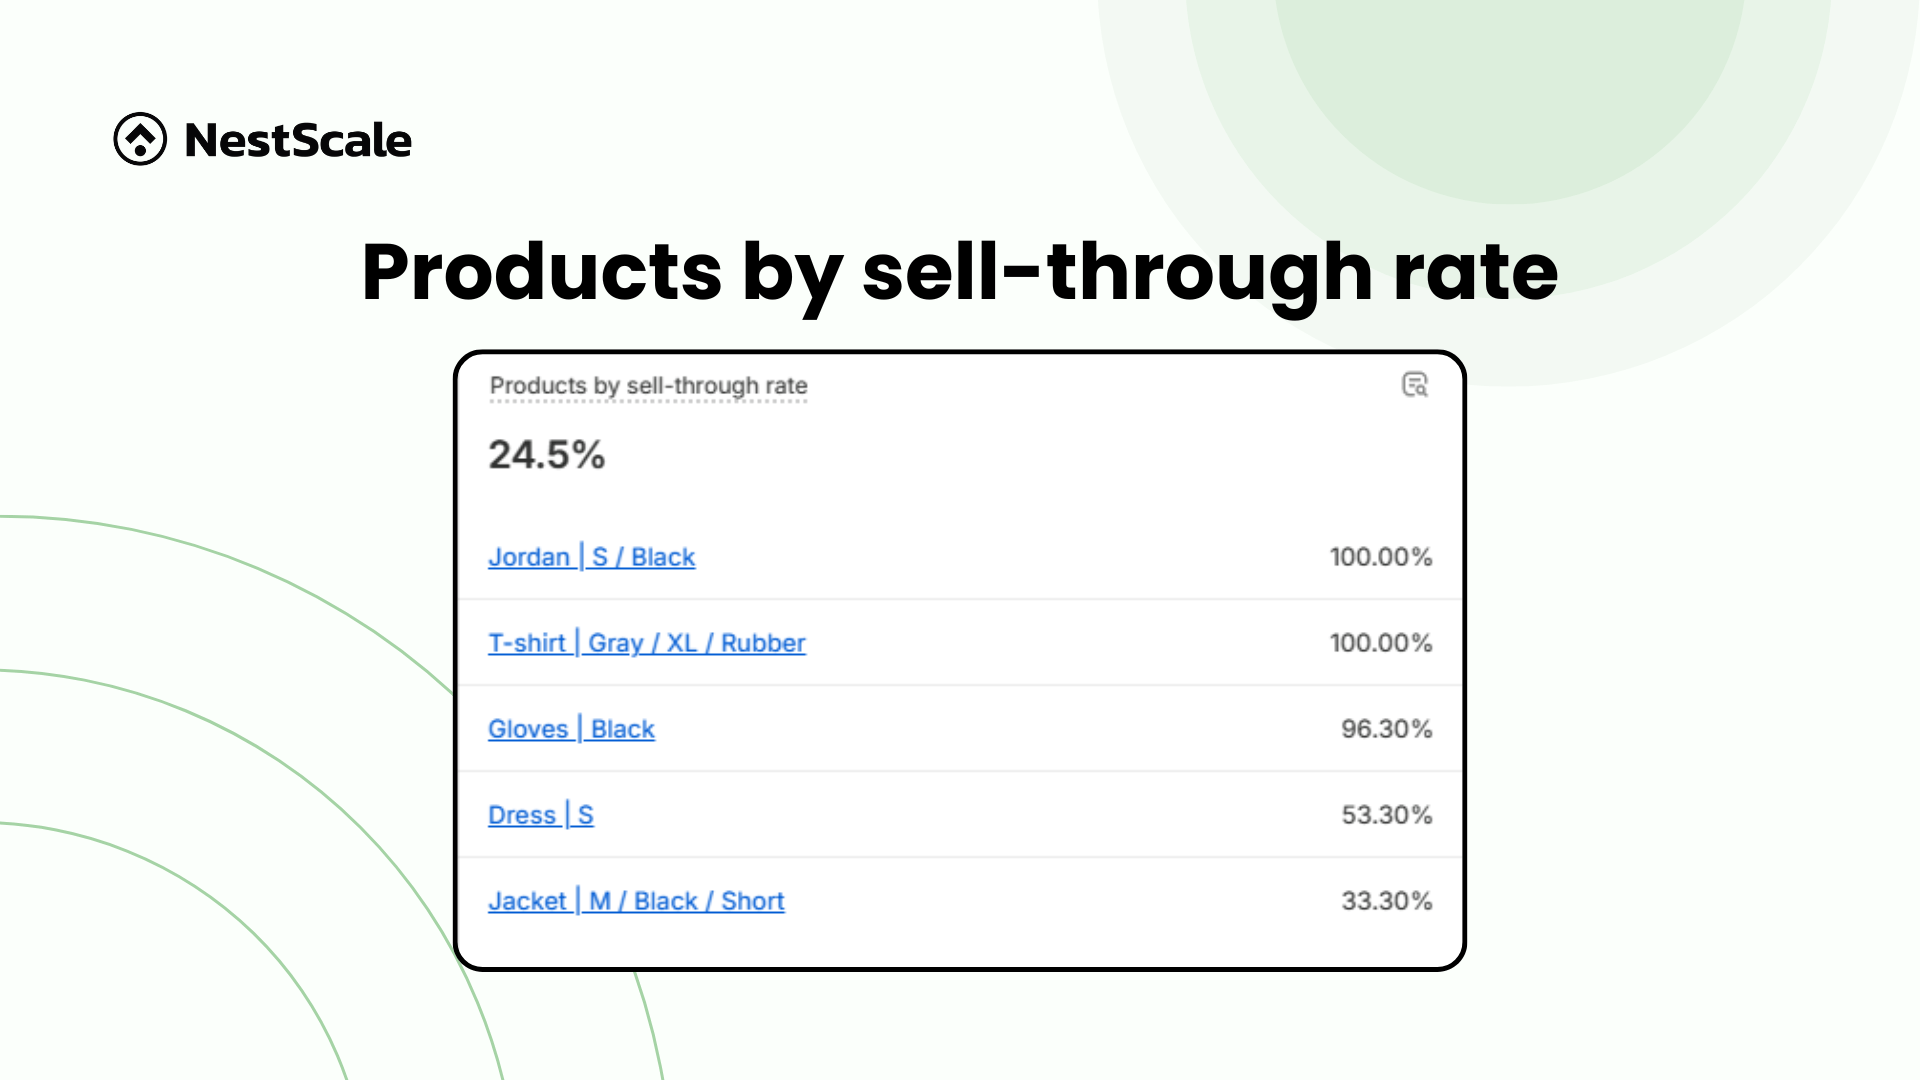
Products by sell-through rate
This metric measures the percentage of inventory sold over a specific period. It is crucial for inventory management, helping you determine which products are performing well and which are not. Tracking this helps in making informed decisions about stock replenishment and clearance sales.
Sales attributed to marketing
We’ve discussed tracking total sales metrics previously. However, sales can also be used to measure the effectiveness of your marketing efforts. Shopify Analytics offers a feature called sales attributed metrics, which allows you to see the total sales generated by customers who clicked on a specific marketing campaign or advertisement and made a purchase within a certain timeframe.
This is essential for evaluating the effectiveness of your marketing campaigns and understanding which channels drive the most sales. With this insight, you can allocate your marketing budget more effectively, maximizing your return on investment.
Returning customer rate
This rate measures the percentage of customers who have made more than one purchase. It’s a crucial indicator of customer loyalty and the effectiveness of your customer retention strategies. A high returning customer rate suggests a satisfied customer base and contributes to sustainable business growth.

Advantages & disadvantages of tracking metrics in Shopify Analytics
Shopify Analytics is a really convenient tool that Shopify merchants can use to keep track and get data-driven insight for improvement. While it offers numerous benefits, it also presents certain limitations. Understanding these can help merchants maximize their use of the platform.
Now, let’s delve deeper into the advantages and disadvantages of using Shopify Analytics to monitor your store’s metrics:
Advantages
- Seamless integration: Shopify Analytics is built into the Shopify admin, providing a user-friendly and accessible way for merchants to view and analyze data. This integration ensures that all the metrics you monitor are always up-to-date and reflect real-time changes in your store activity.
- User-friendly: The KPI dashboard within Shopify is simple and easy to navigate. You can customize the overview report with the metrics you need, and all metrics are presented in a straightforward visualization, often with simple charts that show changes over time. This makes it accessible even for new merchants, allowing easy navigation through Shopify Analytics.
Disadvantages
- Limited advanced analytical capabilities: While Shopify Analytics is easy to understand and monitor, making it friendly for new users, it primarily meets basic and intermediate needs. It may not suffice for advanced analytical requirements because it tends to provide a general view of how your store and customers are performing, rather than explaining why certain actions are happening.
- Limited metrics to only store performance: Since Shopify Analytics is deeply integrated into Shopify’s ecosystem, the scope of tracking is limited to performance within this platform. Expanding tracking capabilities across other platforms or for more detailed insights would require additional tools or integrations.
Are there any solutions to bridge the gap?
You’ve just explored everything you need to know about the Shopify metrics & KPIs crucial for tracking your store’s performance. Shopify Analytics is a very convenient tool for gaining insights into your overall performance, and if that’s your main goal, then it will serve you well. However, if you want to delve deeper into your customers’ actions, their journeys, and your marketing performance across different channels, then relying solely on Shopify Analytics might limit your understanding.
To enhance your Shopify analytics, consider integrating NestAds for a more comprehensive view. NestAds allows you to see how various channels drive traffic and sales and the complete customer journey, helping you make informed decisions quickly and accurately. It also presents you with the most essential e-commerce metrics, making it accessible and actionable, with the added benefits of enhanced privacy and seamless integration.
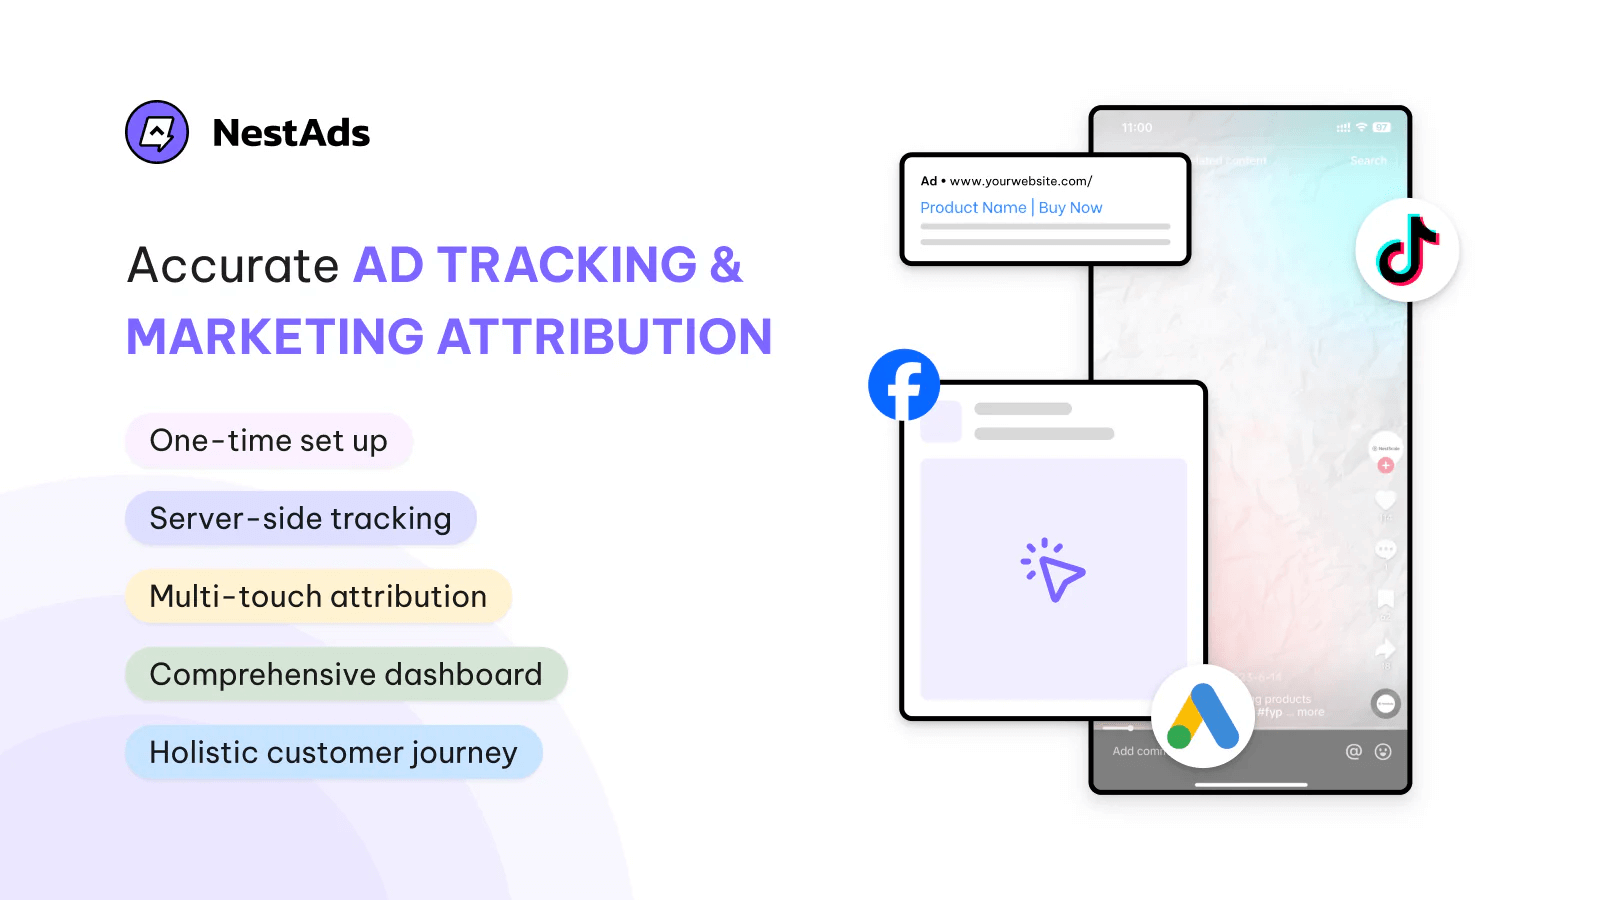
This combination makes it an indispensable tool for Shopify merchants looking to optimize their marketing efforts and gain a complete understanding of customer behavior. So, if you’re ready to take your Shopify store to the next level, give NestAds a try!