

In today’s digital landscape, understanding the intricacies of Shopify analytics is paramount for e-commerce success. Whether you’re a seasoned Shopify merchant or just starting your online store journey, grasping the fundamentals of Shopify Analytics can empower you to make informed decisions, optimize your store’s performance, and drive growth.
In this blog post, we’ll delve deep into the world of Shopify analytics, exploring key metrics, tools, and strategies to unlock the full potential of your e-commerce business. Let’s dive in and uncover the insights that will propel your Shopify store to new heights!
What is Shopify Analytics?
Shopify analytics is a comprehensive suite of tools and reports provided by Shopify. It allows store owners to review their store’s recent activity, gain insights into visitor behavior, analyze web performance, and examine transactions.
This feature is accessible to all Shopify merchants, offering a wide range of reports including finances, fraud, order, acquisition, inventory, behavior, marketing, sales, retail sales, profit, and customer reports. The analytics and reports are designed to help businesses understand their store’s performance. From that, they can identify advertising trends, and make data-driven decisions to boost site reputation and sales.
How to use Shopify Analytics?
In this section, we will delve into the essential sections of Shopify Analytics, from Analytics to Reports and Live, to provide you with crucial insights into your E-Commerce data and how to utilize it effectively.
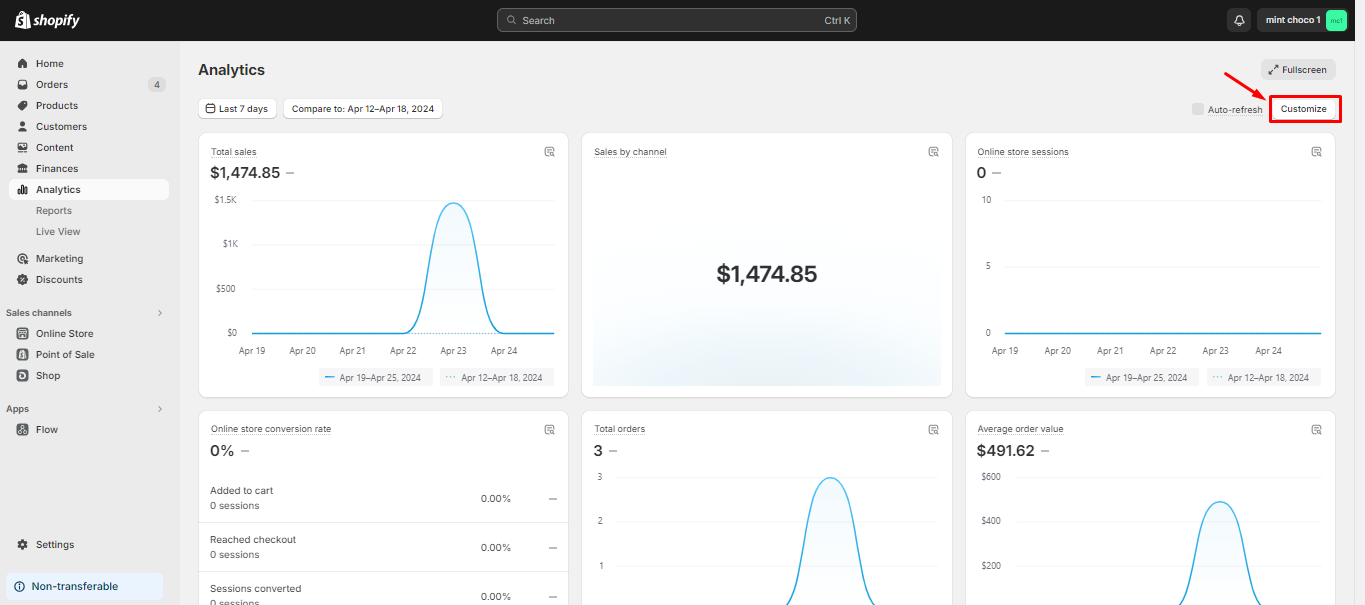
Section #1: Overview Analytics
When you click on the Analytics feature in Shopify, the first thing you’ll see is the overview dashboard. This dashboard provides a general view of various metrics for your store, organized by sections. Within each section, Shopify Analytics lets you see visualizations of each metric’s fluctuations over time and comparisons across different periods.
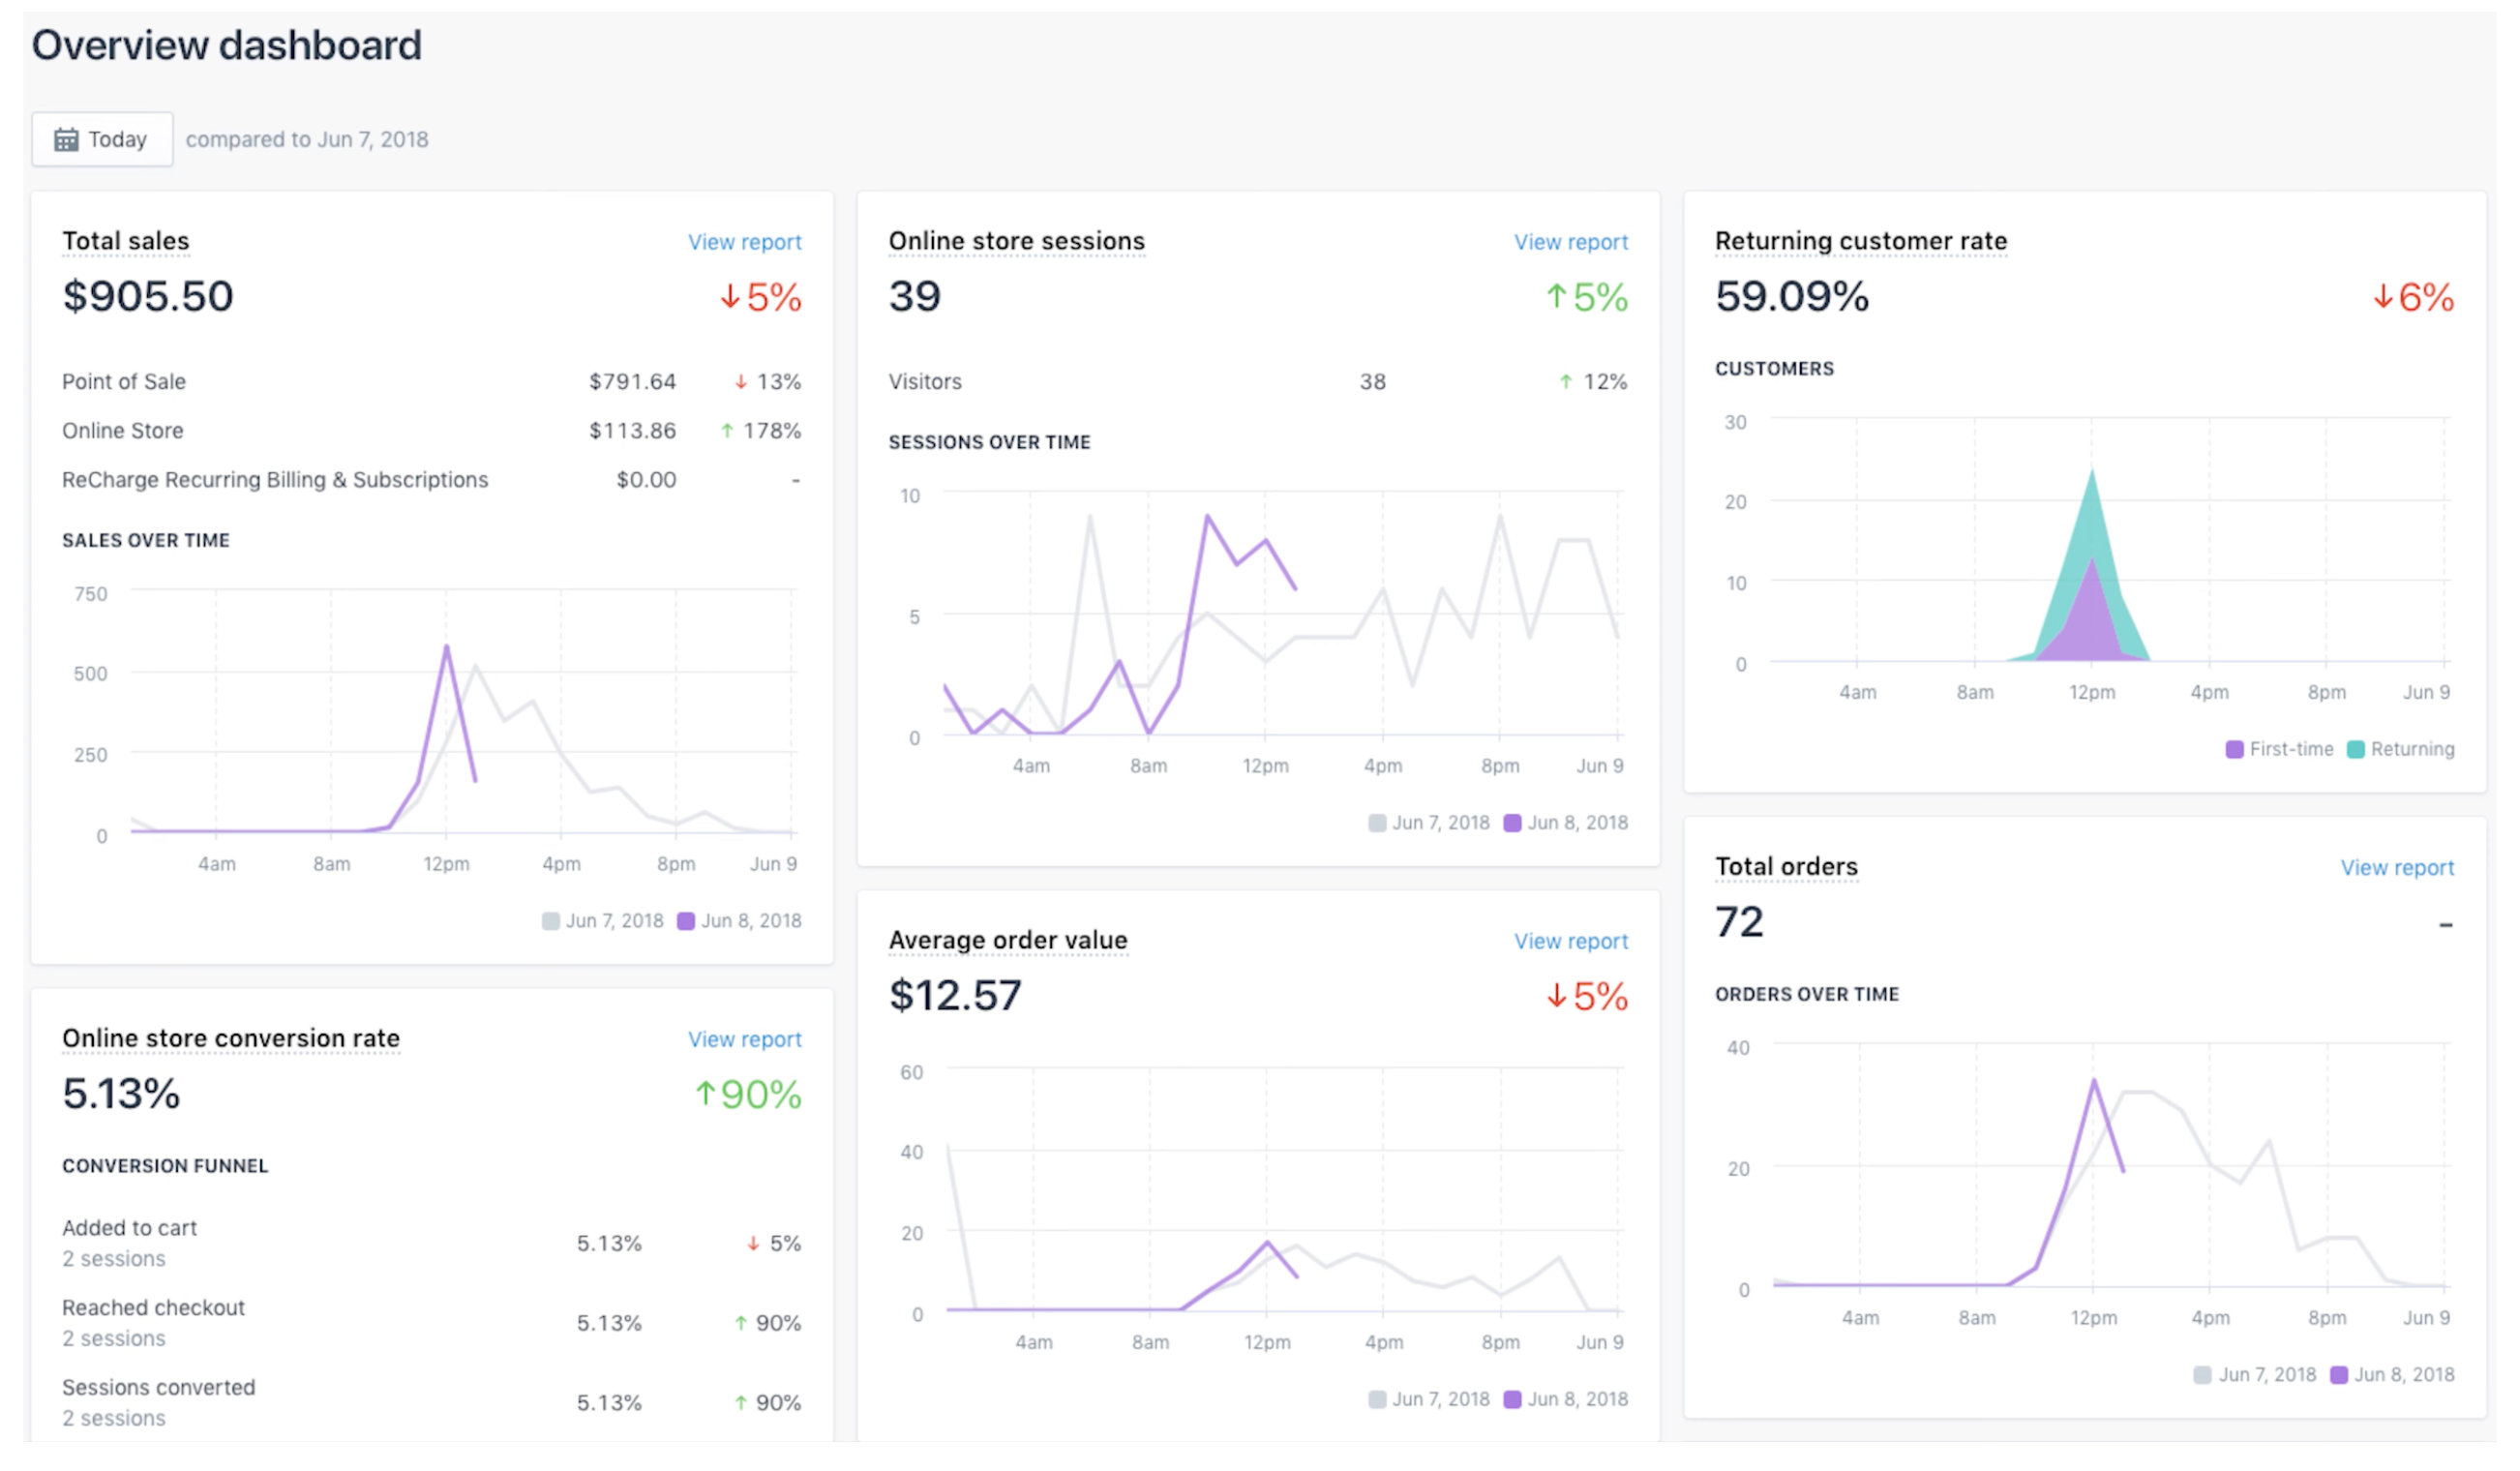
For instance, the Total sales card offers a percentage-based comparison of sales performance over a defined period. It provides users with immediate insights into revenue fluctuations. The Sales by-channel graphic presents a comparative analysis of sales across different channels. It facilitates effortless identification of shifts in sales trends.
Moreover, metrics such as Online store conversion rate offer users a quick glimpse into their conversion performance. While metrics like Returning customer rate, Average order value, and Total orders serve as vital indicators for monitoring business growth and customer engagement.
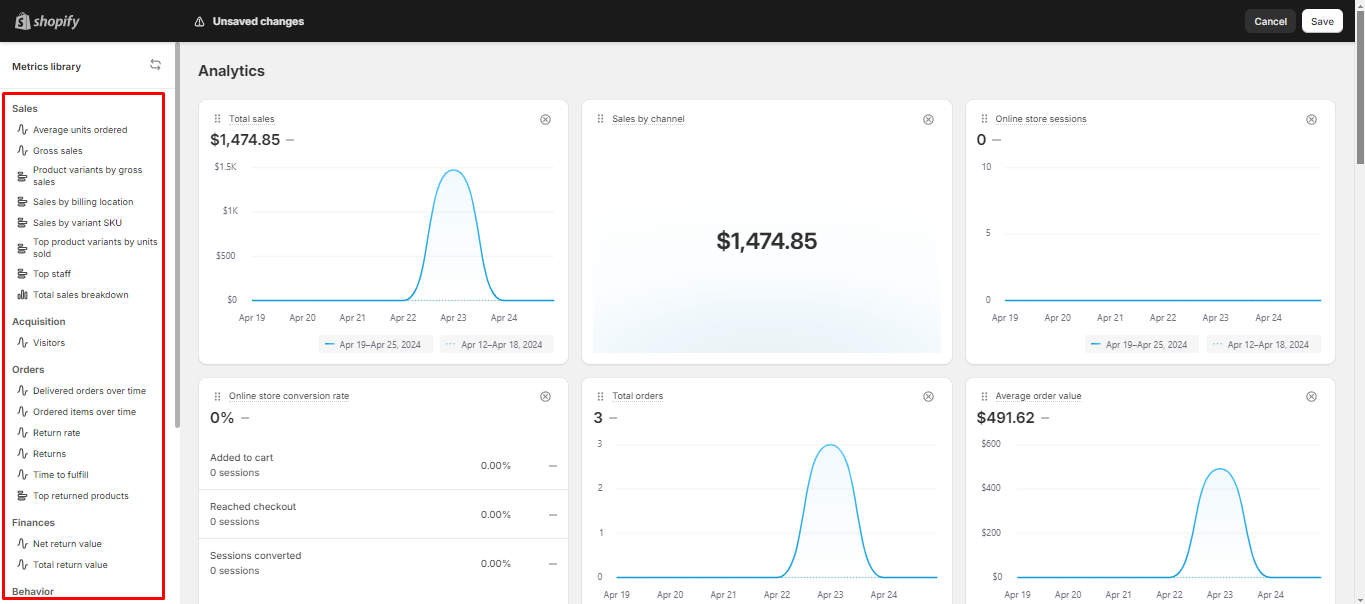
You can also customize your overview dashboard by adding the metrics you need to monitor closely. First, click on Customize.
Then, you can add more metrics by dragging a report option from the column on the left-hand side to your report.
Section #2: Reports
In addition to the main Analytics section, users can explore deeper insights through the dedicated Reports section, catering to those seeking a more comprehensive understanding of their data landscape. In order to view the detailed reports for each metrics, click on View reports for each metrics in the overview dashboard, or click on Reports and choose the metrics that you want to see.
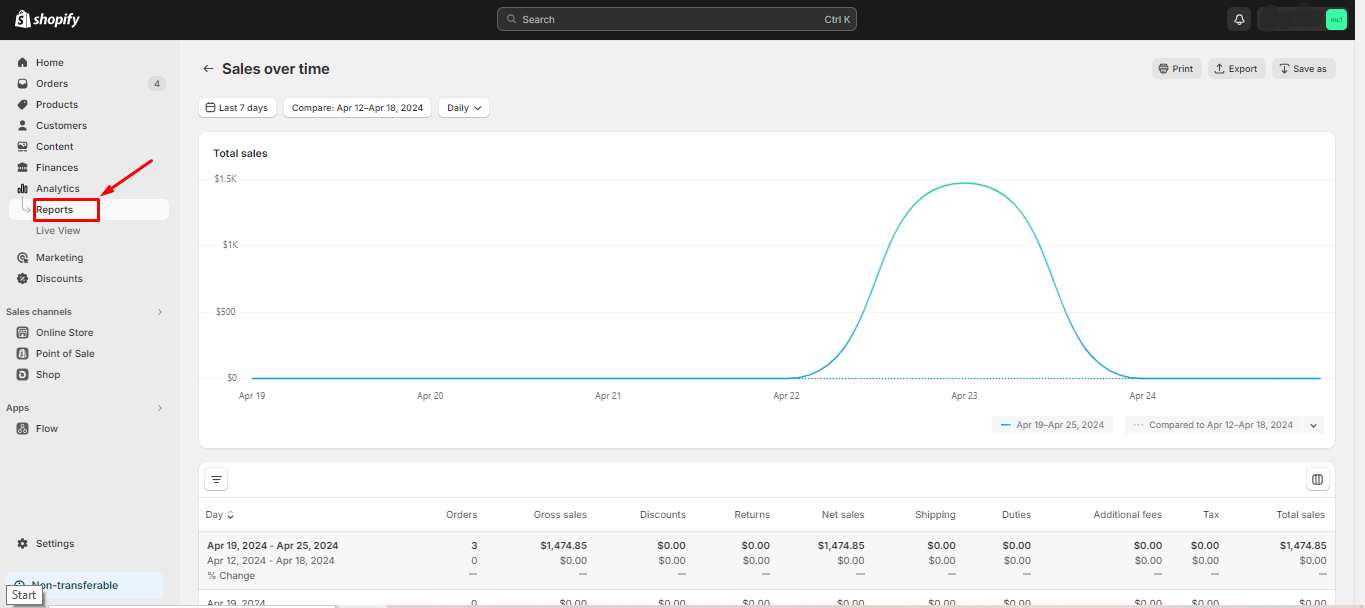
Shopify provides an extensive suite of analytics and reporting tools aimed at furnishing users with comprehensive insights across various facets of their business operations. Each distinct category of reports is tailored to address specific aspects:
| Report category | Detailed |
|---|---|
| Acquisition reports | Offer insights into users acquisition by analyzing the performance of different traffic sources and the pathways users take to reach your store. |
| Behavior reports | Dissect user interactions within the store, enabling you to identify areas for optimization and refinement based on engagement metrics. |
| Customer reports | Focus on customer behaviors, such as repeat purchases and overall engagement, helping to analyze shopping patterns and enhance customer satisfaction levels. |
| Finances reports | Offer detailed breakdowns of financial performance, including sales, payments, and taxes. These reports provide users with a comprehensive overview of their store’s financial health. |
| Inventory reports | Provide insights into product availability and facilitate efficient inventory management, empowering users to maintain optimal stock levels and minimize stockouts. |
| Marketing reports | Analyze the effectiveness of marketing campaigns, informing users about the impact of their efforts and helping to shape future strategies. |
| Orders report | Offer detailed insights into store orders, shedding light on sales trends and customer preferences to facilitate informed decision-making. |
| Sales report | Offer a holistic view of overall sales performance, equipping users with essential insights necessary for driving growth and profitability. |
Shopify Analytics’s reports are essential for conducting dependable data analysis and furnishing users with actionable insights to enhance business performance.
Section #3: Live view
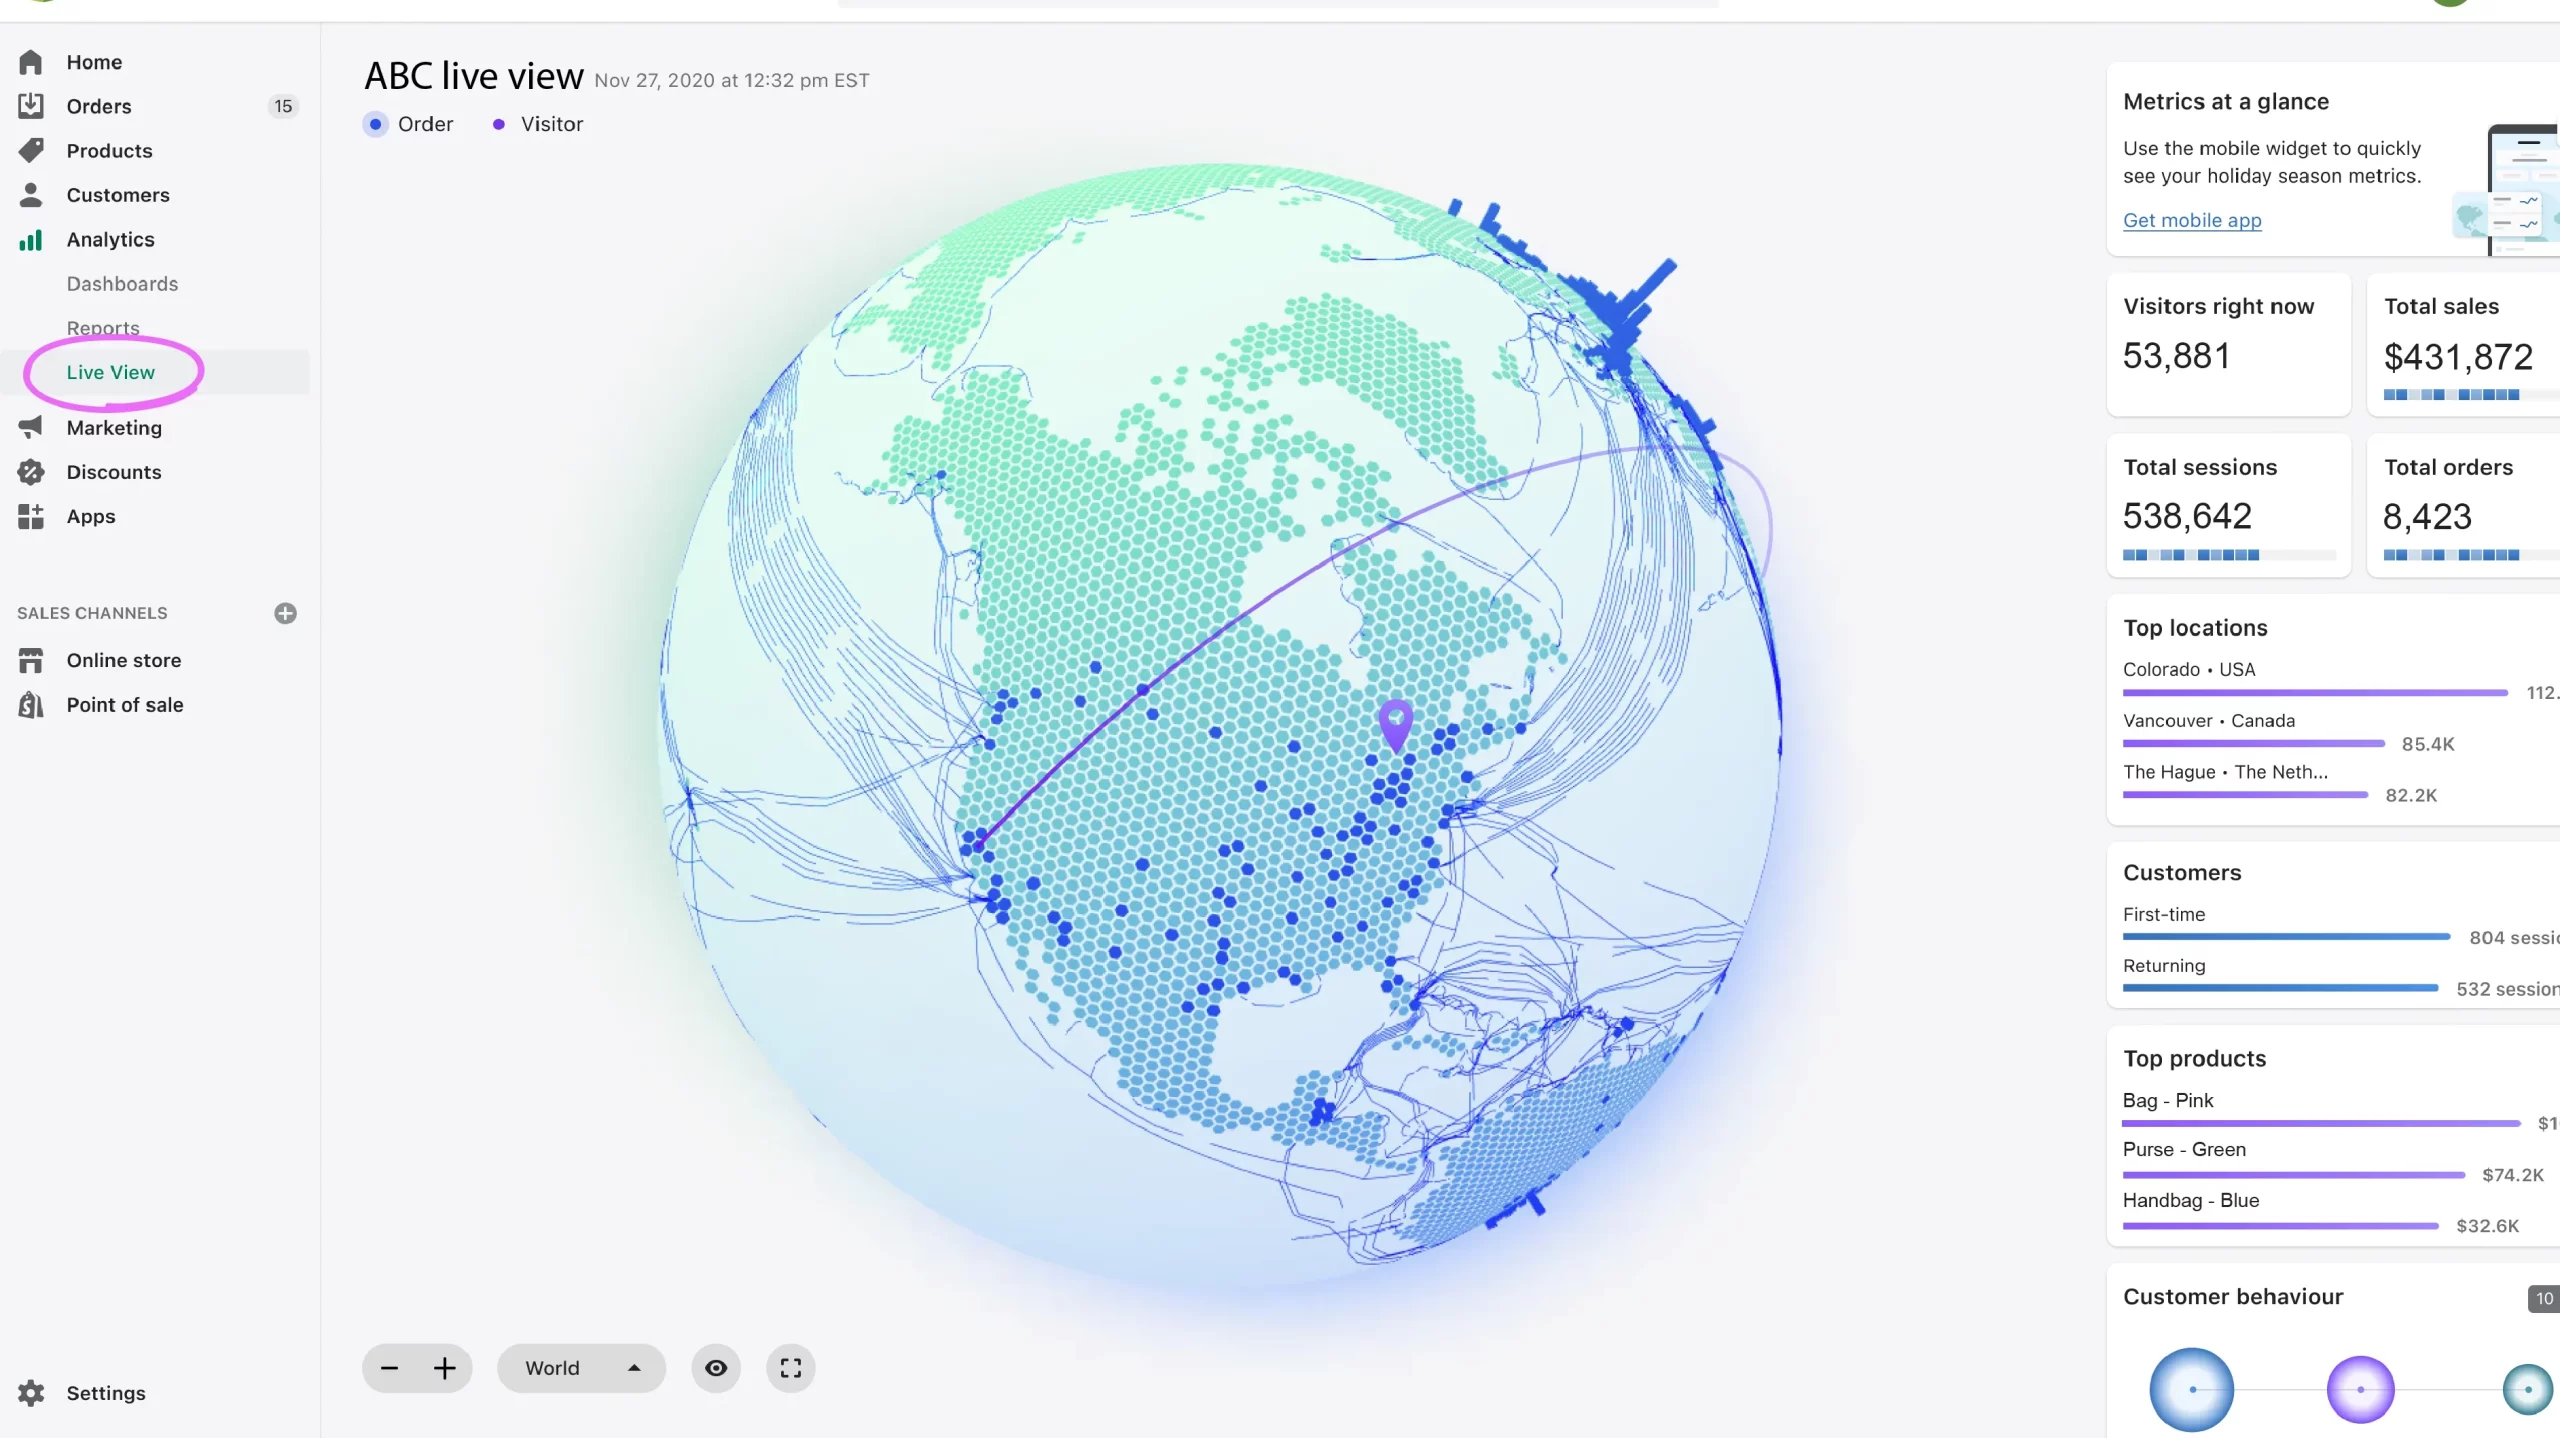
The Shopify Analytics Live View feature offers a real-time glimpse into the ongoing store activity. It provides instant updates on key metrics. Here’s a breakdown of the components displayed within the feature:
- Visitors Right Now: This section indicates the current number of active visitors on your site, offering immediate visibility into site traffic.
- Total Sales: Displayed within a specific time frame, this metric showcases the total revenue generated, allowing for real-time tracking of sales performance.
- Total Sessions: This component illustrates the total number of individual browsing sessions occurring on your site within the same time frame, offering insights into user engagement.
- Total Orders: The number of orders placed within the designated time frame is highlighted here, providing a snapshot of purchasing activity.
Additionally, the Live View report furnishes details on various aspects of customer engagement, including:
- Top Locations: An overview of geographic locations where the majority of browsing sessions originate, aiding in understanding regional customer demographics and preferences.
- Customers: This section breaks down the number of new versus returning customers, offering insights into customer acquisition and retention efforts.
- Top Products: Highlighting the best-selling products during the current period. This feature enables merchants to identify popular items and adjust inventory or marketing strategies accordingly.
- Customer Behavior: Providing insights into customer actions such as active checkout processes or completed purchases. This section offers valuable data for assessing conversion rates and optimizing the user experience.
Overall, the Live View feature is designed to provide merchants with a dynamic overview of store performance & customer activities in real time. From that, it facilitates prompt and informed decision-making.
What are the important metrics you should track?
Shopify Analytics offers a wide range of metrics to explore. Based on our experience, some metrics are particularly accurate and valuable. These primarily focus on your store’s sales performance, including best-selling products, revenue trends, and peak sales periods. Shopify Analytics effectively provides this data.
Sales metrics
- Total sales: The revenue generated through your online store or Point Of Sale if you have a physical storefront.
- Sales source: This lists the sources your sales were generated, such as social media channels, ads, or organic, direct traffic.
- Total orders: The total number of orders generated through both your E-Commerce store and physical store.
Customer metrics
- Top products by units sold: Identifies the items in your store that sold the most by volume, helping you identify your most popular offerings.
- Top site landing pages: Identifies the most frequent landing pages on your site where visitors started a session.
- Returning customer rate: Indicates the percentage of customers who have made repeat purchases within a selected period.
Shopify behavior reports
- Track changes in your online store conversions over time.
- Determine the top online searches for your product.
- Track changes in your product recommendations over a given period.
Advantages & Disadvantages of Shopify Analytics
As you can see, Shopify Analytics offers a range of features that can be extremely beneficial for e-commerce store owners. However, like any tool, it also has its limitations. Here are some of the key advantages and disadvantages of using Shopify Analytics that we recommend you to consider:
Advantages
- Integration: As a built-in feature of Shopify, it seamlessly integrates with your store, providing insights without the need for additional software or complex setups.
- User-friendly interface: Shopify Analytics is designed for ease of use, making it accessible even to those who are not very tech-savvy. Its dashboard and reports are straightforward and easy to navigate.
- E-commerce specific metrics: It is tailored specifically for e-commerce, offering metrics that are directly relevant to online retail such as sales data, customer return rate, average order value, and more.
- Real-time data: Shopify Analytics provides real-time data, allowing store owners to see what is happening in their store at any given moment, which is crucial for making timely business decisions.
Disadvantges:
- Limited in scope: While Shopify Analytics is great for basic and some intermediate level insights, it might not be as comprehensive as specialized analytics tools like Google Analytics, especially for advanced data analysis needs.
- No cross-domain tracking: Unlike Google Analytics, Shopify Analytics does not support cross-domain tracking, which can be a limitation for businesses that operate multiple domains or subdomains.
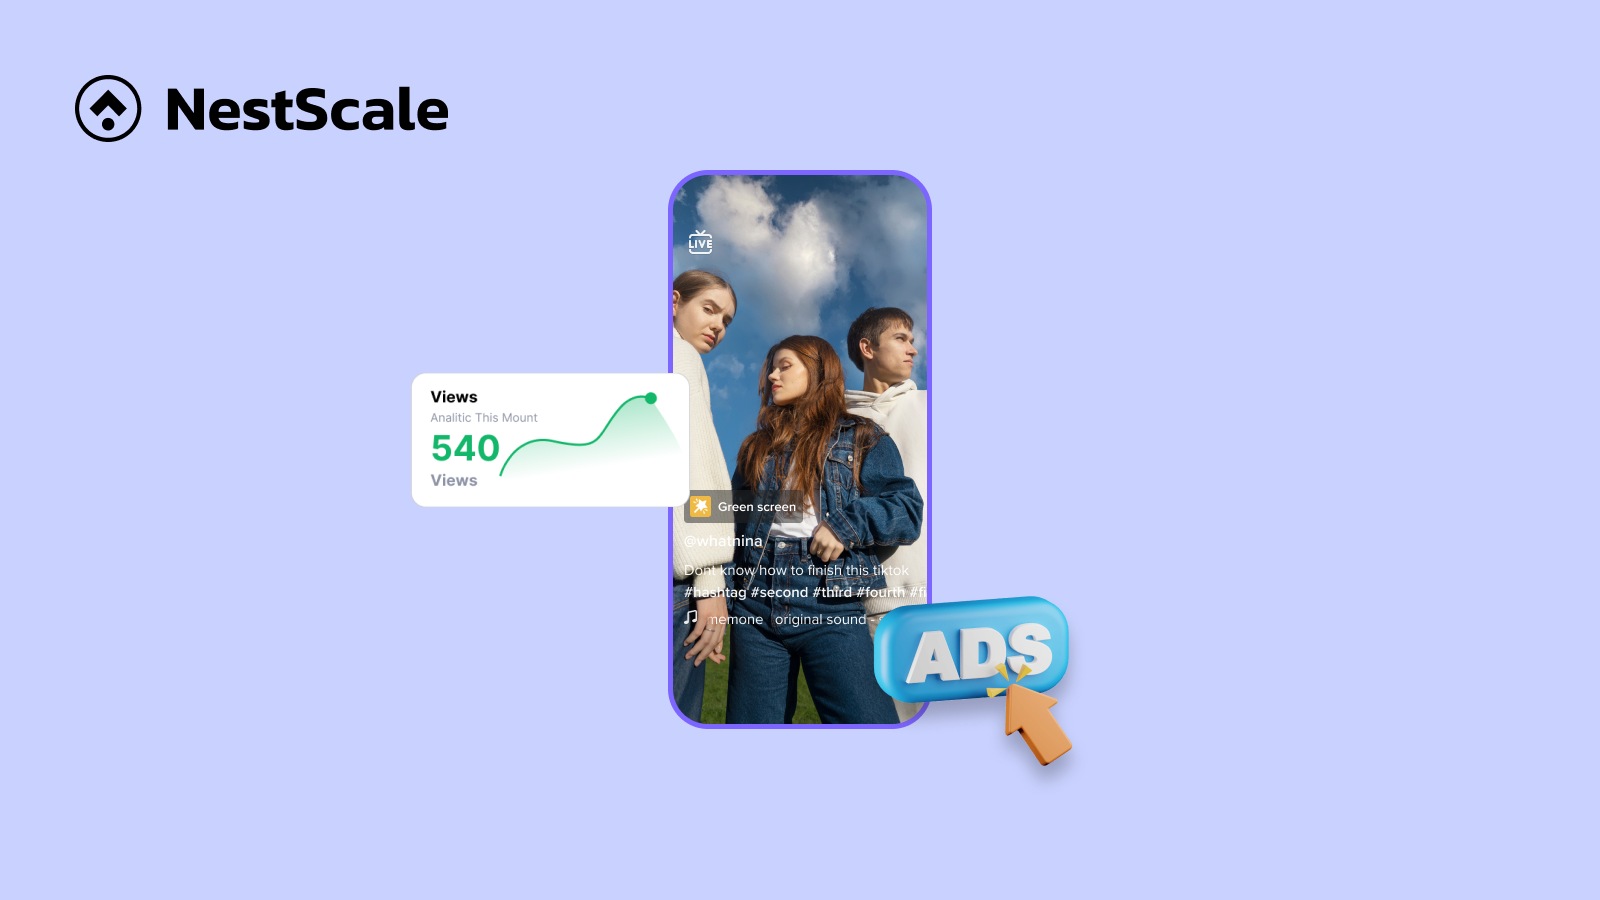
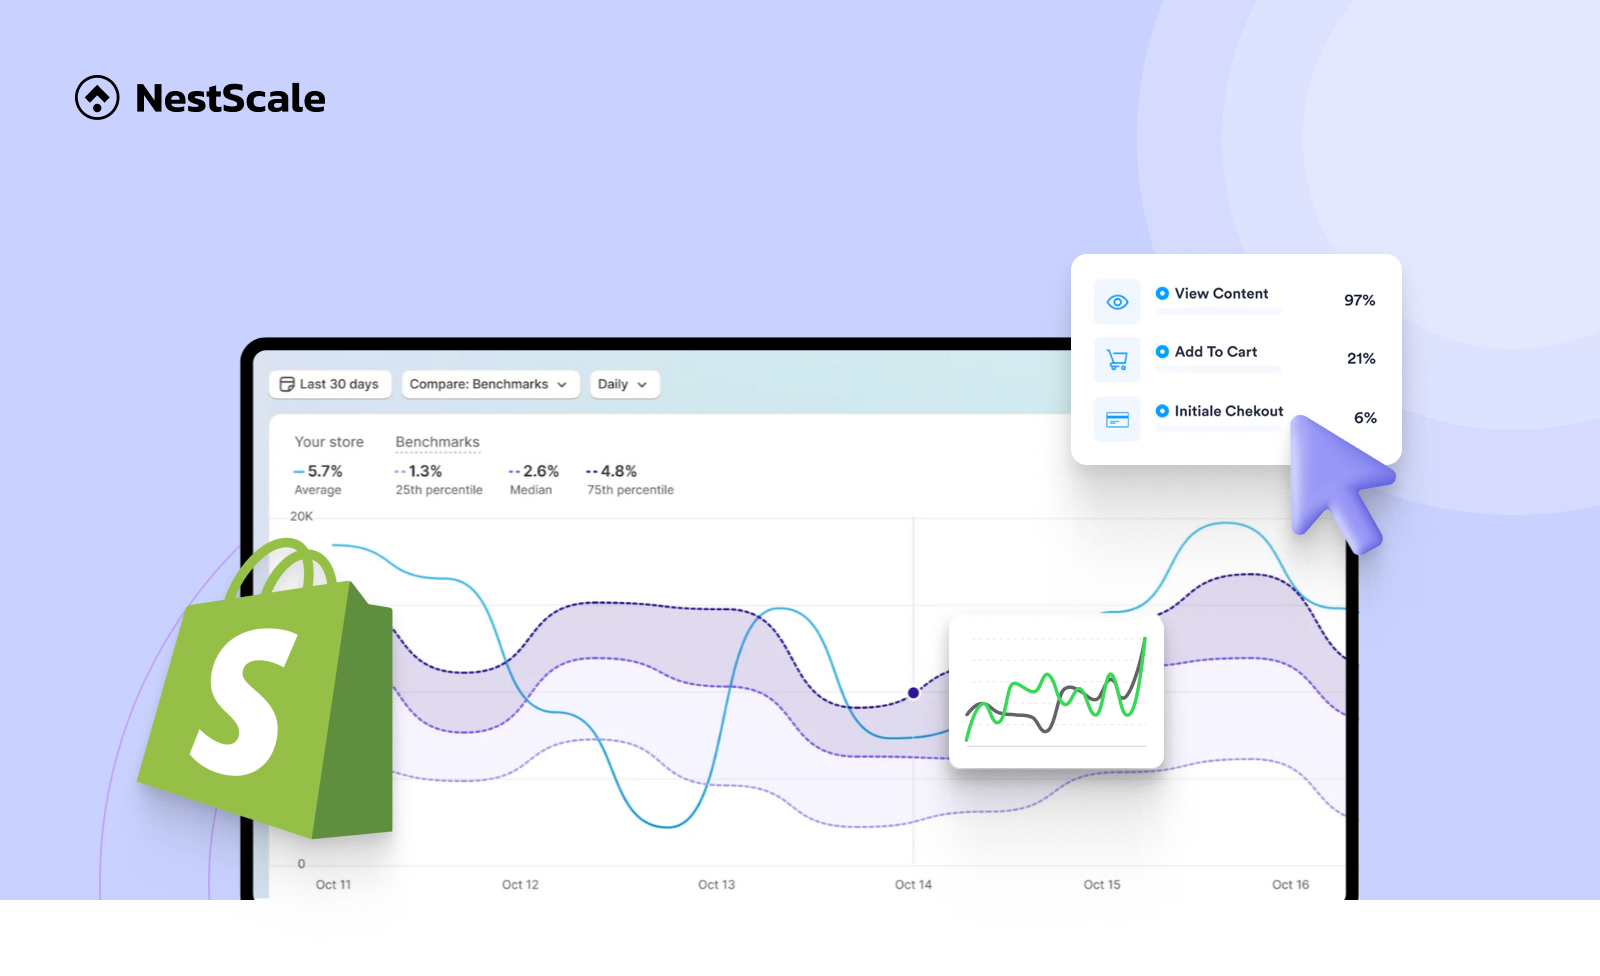
- No integration with external advertising platforms: While it integrates well within the Shopify ecosystem, it lacks direct integrations with external advertising platforms. This means additional steps are necessary to analyze marketing campaigns from other sources like Facebook or Google Ads.
How to bridge the gap of Shopify Analytics?
Shopify does a pretty good job of telling you the sales performance much more accurate than any other analytics tool like GA4. However, as the main problems of Shopify Analytics is that it only limit to the data of Shopify store only, you won’t be able to see whole picture of the customer’s conversion path. So, how you can fix this?
This is where NestAds becomes a game changer. NestAds offers tracking across multiple channels, including social media, direct, and organic search engine traffic. It also provides a comprehensive view of customer interactions. Additionally, NestAds aggregates customer journeys, empowering merchants to pinpoint the touchpoints that significantly impact sales.
By seamlessly integrating with both NestAds and Shopify pixels, NestAds ensures accurate real-time data without the complexity of GA4. Its partnership with Shopify guarantees privacy protection and adept handling of technical challenges. It offers businesses a more efficient and reliable solution for campaign tracking. With NestAds, Shopify merchants can effortlessly improve their tracking capabilities and gain deeper insights into customer behavior.