







 Facebook Advertising
Understanding the cost of Facebook ads is crucial for any business looking to optimize its digital marketing strategy. Therefore, knowing how Facebook charges for ads and the factors that influence costs can help you make informed decisions and maximize your return on investment. In this blog, we’ll delve into the various aspects of Facebook ad costs and provide practical tips to help you optimize your ad spend.
💡 Key Takeaways
- How much do Facebook ads cost per month? Most small-to-medium businesses spend between $300 and $1,500 per month on Facebook ads.
- What is the minimum daily budget for Facebook ads? Meta’s official absolute minimum is remarkably low—just $1 per day and around $5 per day for link clicks or engagement. The recommended benchmark is to start with at least $10 to $40 per day per ad set.
- How can I lower my Facebook ad costs? To lower your Facebook ad costs, focus heavily on improving your ad creative quality; Meta rewards ads with higher CTR and quality rankings by dropping your cost per click. You should also expand narrow, highly competitive target audiences into broader pools or lookalikes, giving the algorithm the flexibility to find cheaper conversions across Advantage+ automatic placements.

1. How does Facebook charge your ads cost?
Facebook employs two primary methods to charge for ads: the Auction system and Reach and Frequency (previously known as Reservation). Among the many ecommerce businesses we’ve worked with, the auction method is more commonly used for Facebook ad campaigns. This is because it provides more flexibility and control over budget, bids, and targeting. However, it also requires more monitoring to discover the strategies that best boost your sales.
To get the most accurate view of how your ads are costing your business, we suggest looking at your ad budget in two ways:
- Total ads cost: This is the total amount you spend on Facebook Ads. It sets a limit to ensure your ads do not exceed your desired budget.
- Cost of each result: This refers to how much each outcome (click, conversion, etc.) costs you. This perspective helps you evaluate the efficiency of your ad spend.
To be more specific, here are the cost of Facebook ads based on different outcomes:
- Average Facebook ads spend per month
- Facebook ads cost per click
- Facebook ads cost per 1,000 impression
- Average Facebook ads cost per acquisition (CPA)
- Facebook ads cost per lead
- Facebook ads cost per engagement
Why consider these two perspectives? The overall amount spent helps you determine the cost of ads within your operational budget, ensuring your ad spend aligns with your broader business financial plans. Meanwhile, the cost of each result allows you to control and optimize the performance of your ads specifically, ensuring you get the best possible return on investment for each dollar spent.
2. Facebook ads cost breakdown in 2026
Now, we all agree that determining the cost of your Facebook Ads is super important to see how your ads are performing and generating profit for you. It’s helpful to have a benchmark for your business. So, let’s explore the average cost for Facebook Ads and break down two ways of viewing your costs.
Average monthly total Facebook ads spend
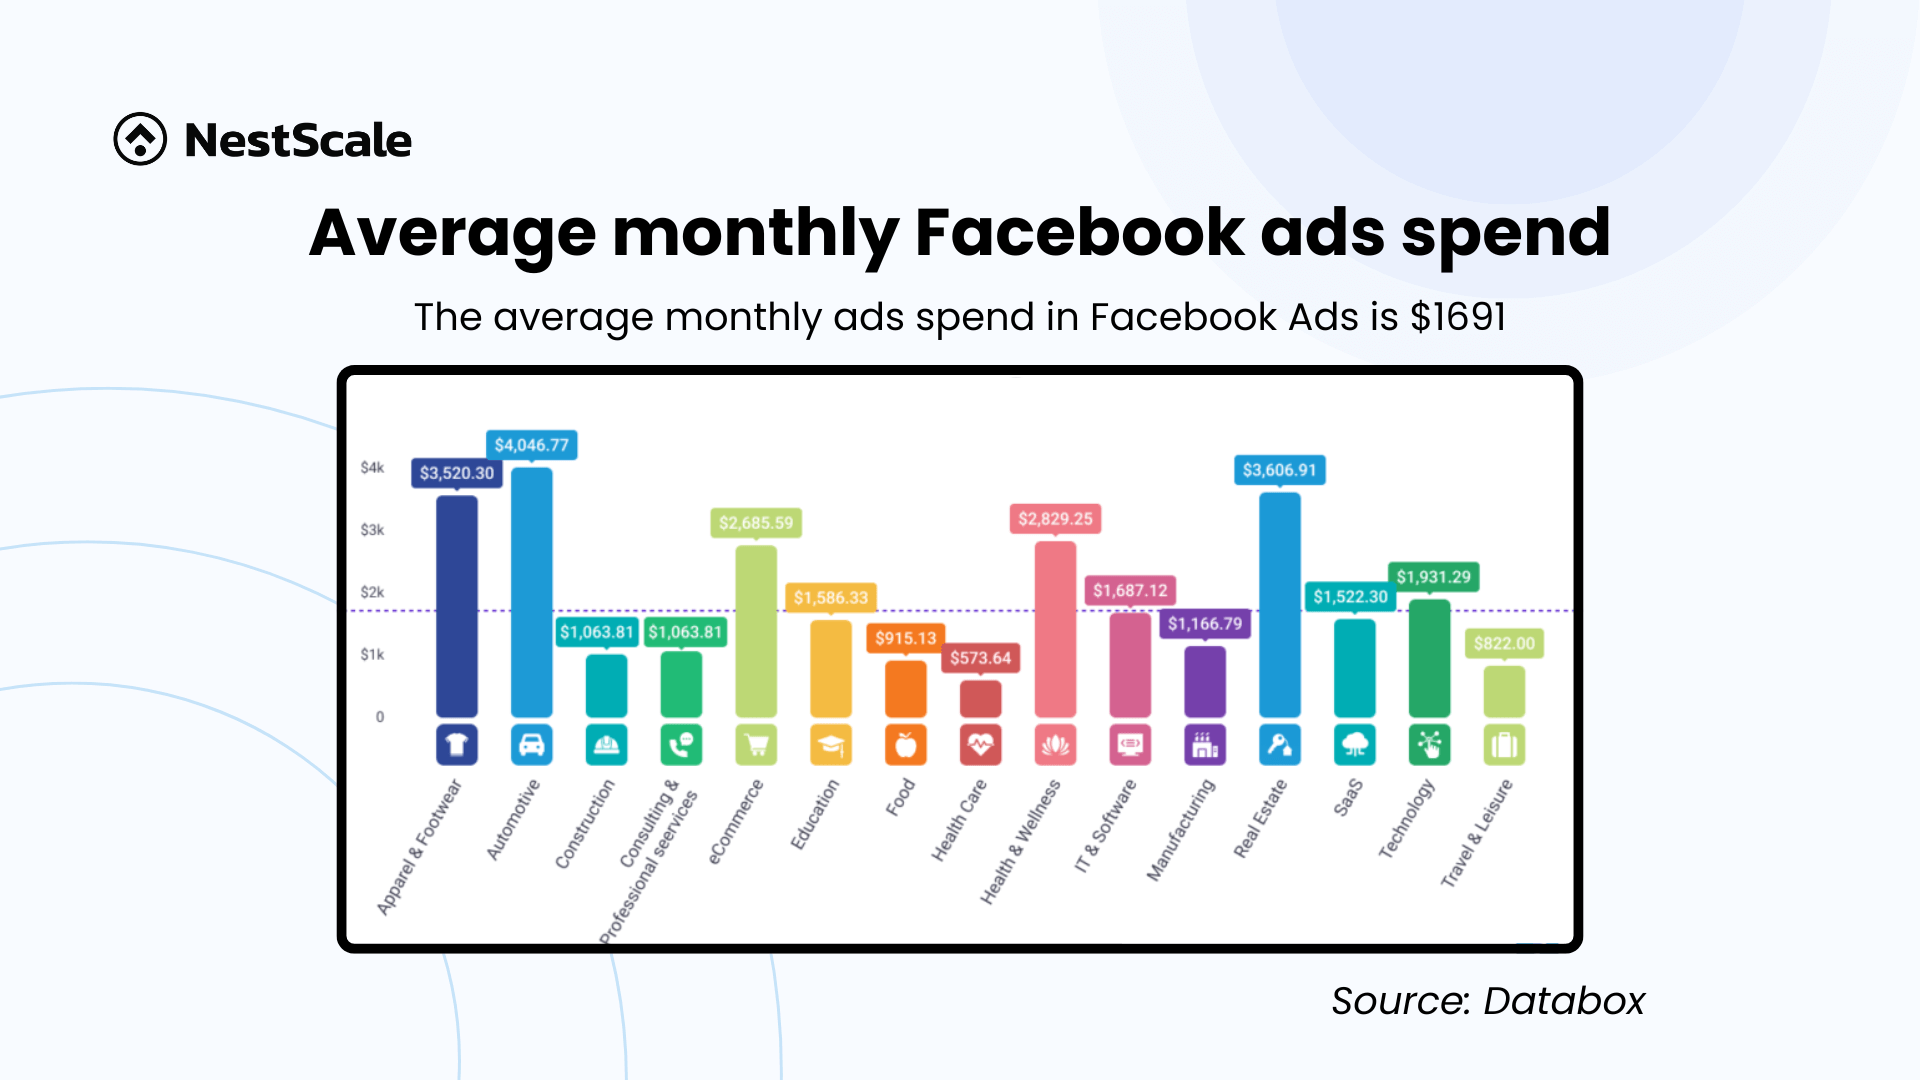
Many businesses allocate a significant portion of their marketing budget to Facebook ads. On average, small to medium-sized businesses spend between $1,000 to $5,000 per month on Facebook ads, with the average monthly spend being approximately $1,691.08. This amount can increase significantly for larger enterprises or during peak seasons like Black Friday or the holiday period, when competition for ad space intensifies.
To effectively manage and optimize your Facebook ad cost, it’s crucial to understand the key cost metrics that influence overall costs. Here, we break down the most important ones: Cost Per Click (CPC), Cost Per Mille (CPM), and Cost Per Acquisition (CPA).
Facebook Ads average cost per click
As of 2025, the average CPC for Facebook ads across all industries is approximately $1.72, according to Wordstream. However, this cost can vary significantly based on the industry, target audience, and other factors. For example, the financial sector faces the highest CPCs, averaging $3.77 per click. This is notably higher compared to the average CPC of around $0.40 across industries reported by Databox in 2023.
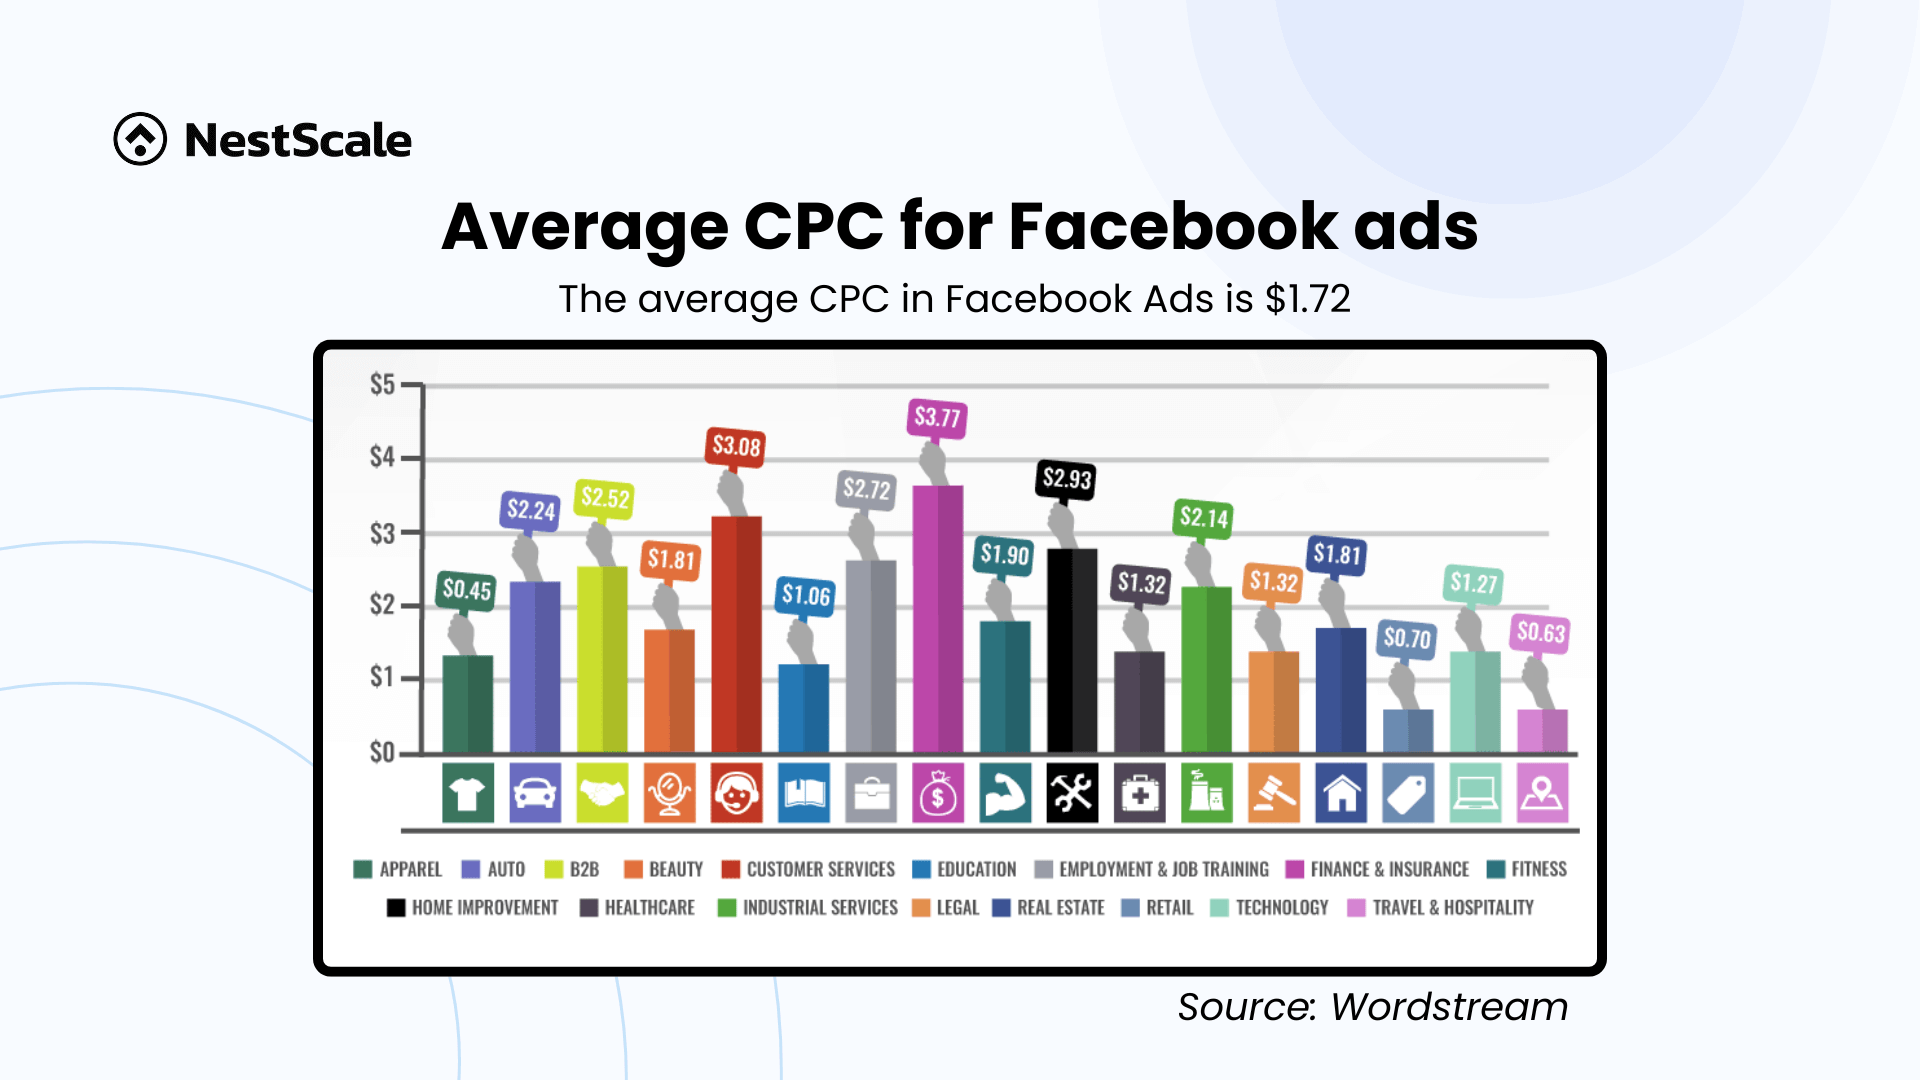
Given the wide fluctuations in CPC data, we suggest aiming for a CPC range of $0.50 to $1.70. Staying within this range typically indicates that your ads are performing well without overspending. This benchmark helps ensure your advertising budget is used efficiently to drive traffic and conversions.
Average Cost per mille (CPM) for Facebook Ads
The cost-per-mille (CPM) metric represents the cost for every 1,000 views or impressions your ad receives. According to Databox, the average CPM for Facebook ads is $5.61. This rate varies significantly across different industries. For instance, the manufacturing sector enjoys the lowest CPM at $2.40, while the technology sector faces the highest CPM at $9.89. This disparity potentially indicates a more competitive advertising landscape or higher costs for effectively reaching the target audience within the technology sector.
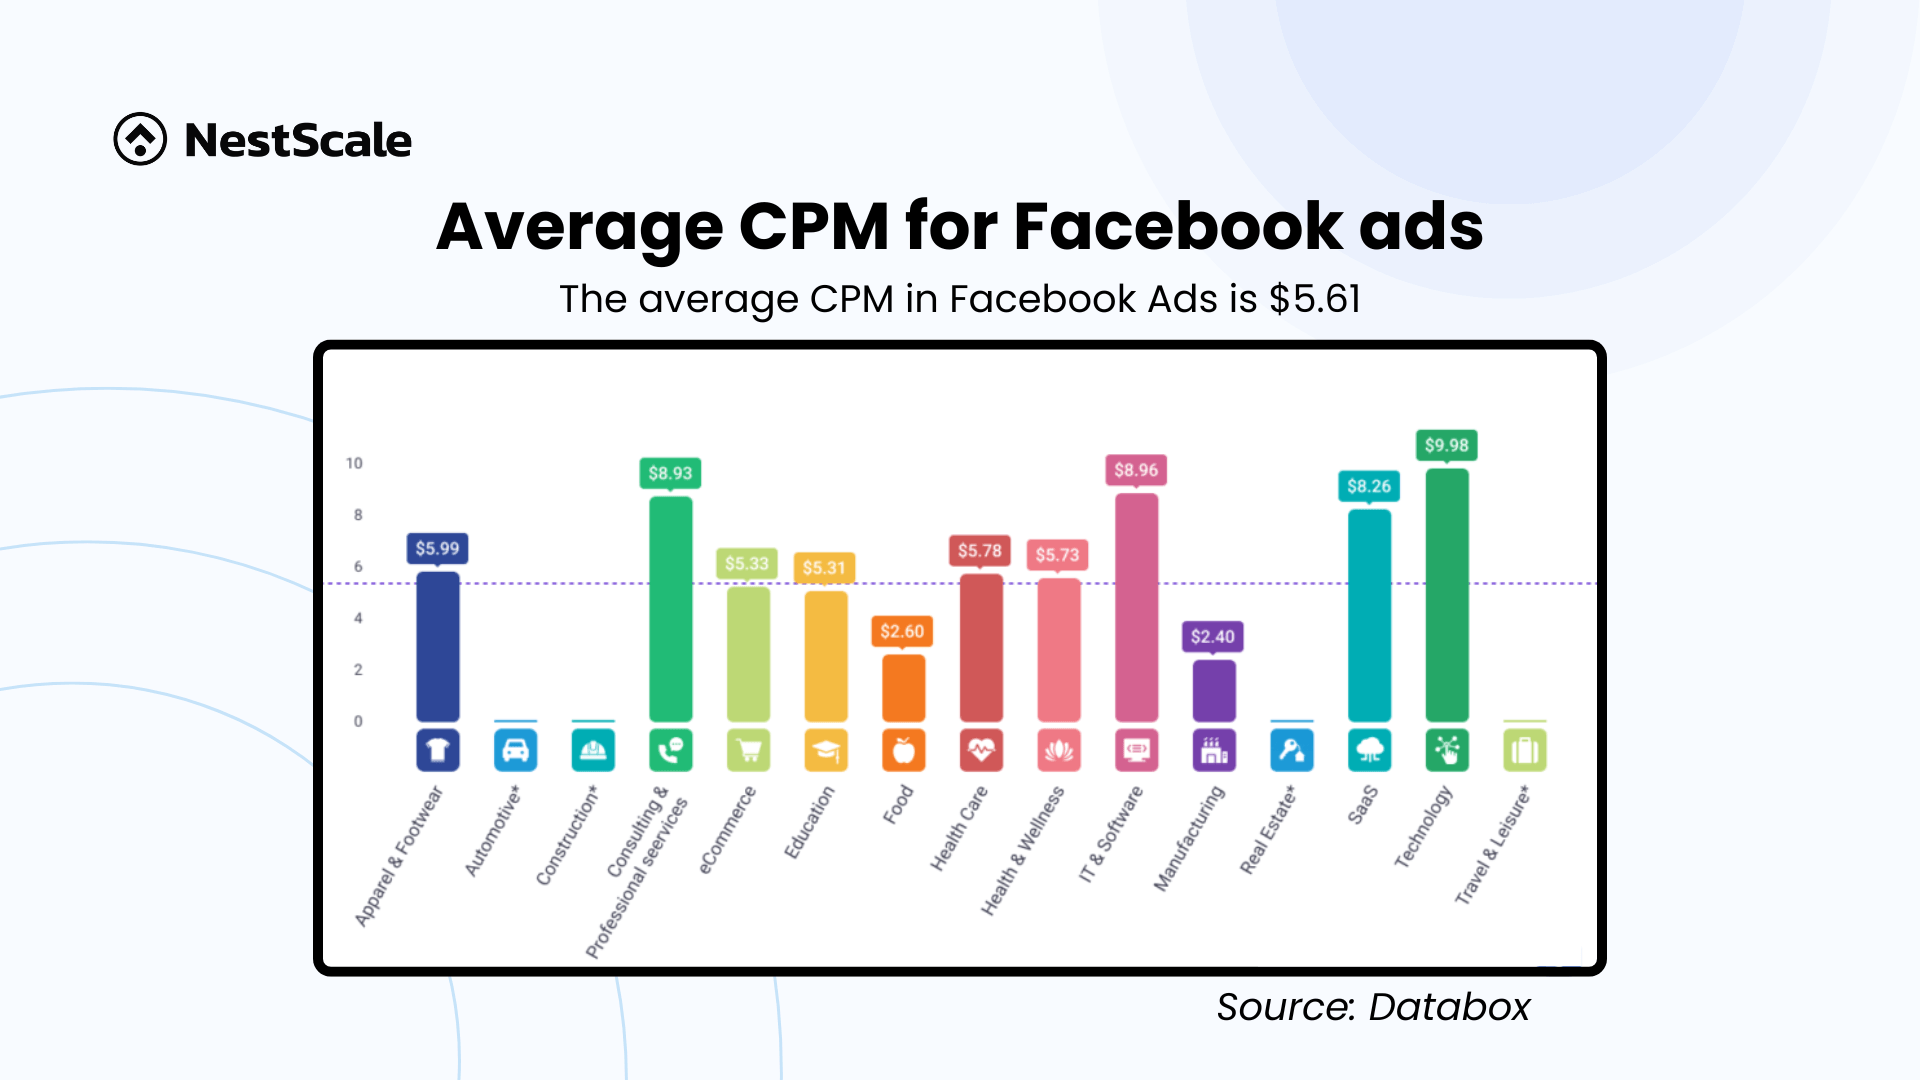
Interestingly, the CPM for Facebook ads has seen a decline compared to 2023. Data from Statista reveals that the average CPM across industries was slightly higher, at $6.30. Similarly, Adflex recorded an average CPM of $7.19 across all industries in 2023. This reduction in CPM suggests that advertisers might currently benefit from lower costs for impressions compared to the previous year.
Based on these insights, a good average CPM to aim for would be in the range of $5 to $8. This range is considered effective and indicative of well-performing ads. By understanding and targeting this benchmark, businesses can optimize their ad spend to achieve a balance between cost-efficiency and broad audience reach.
Average Facebook ads cost per acquisition (CPA)
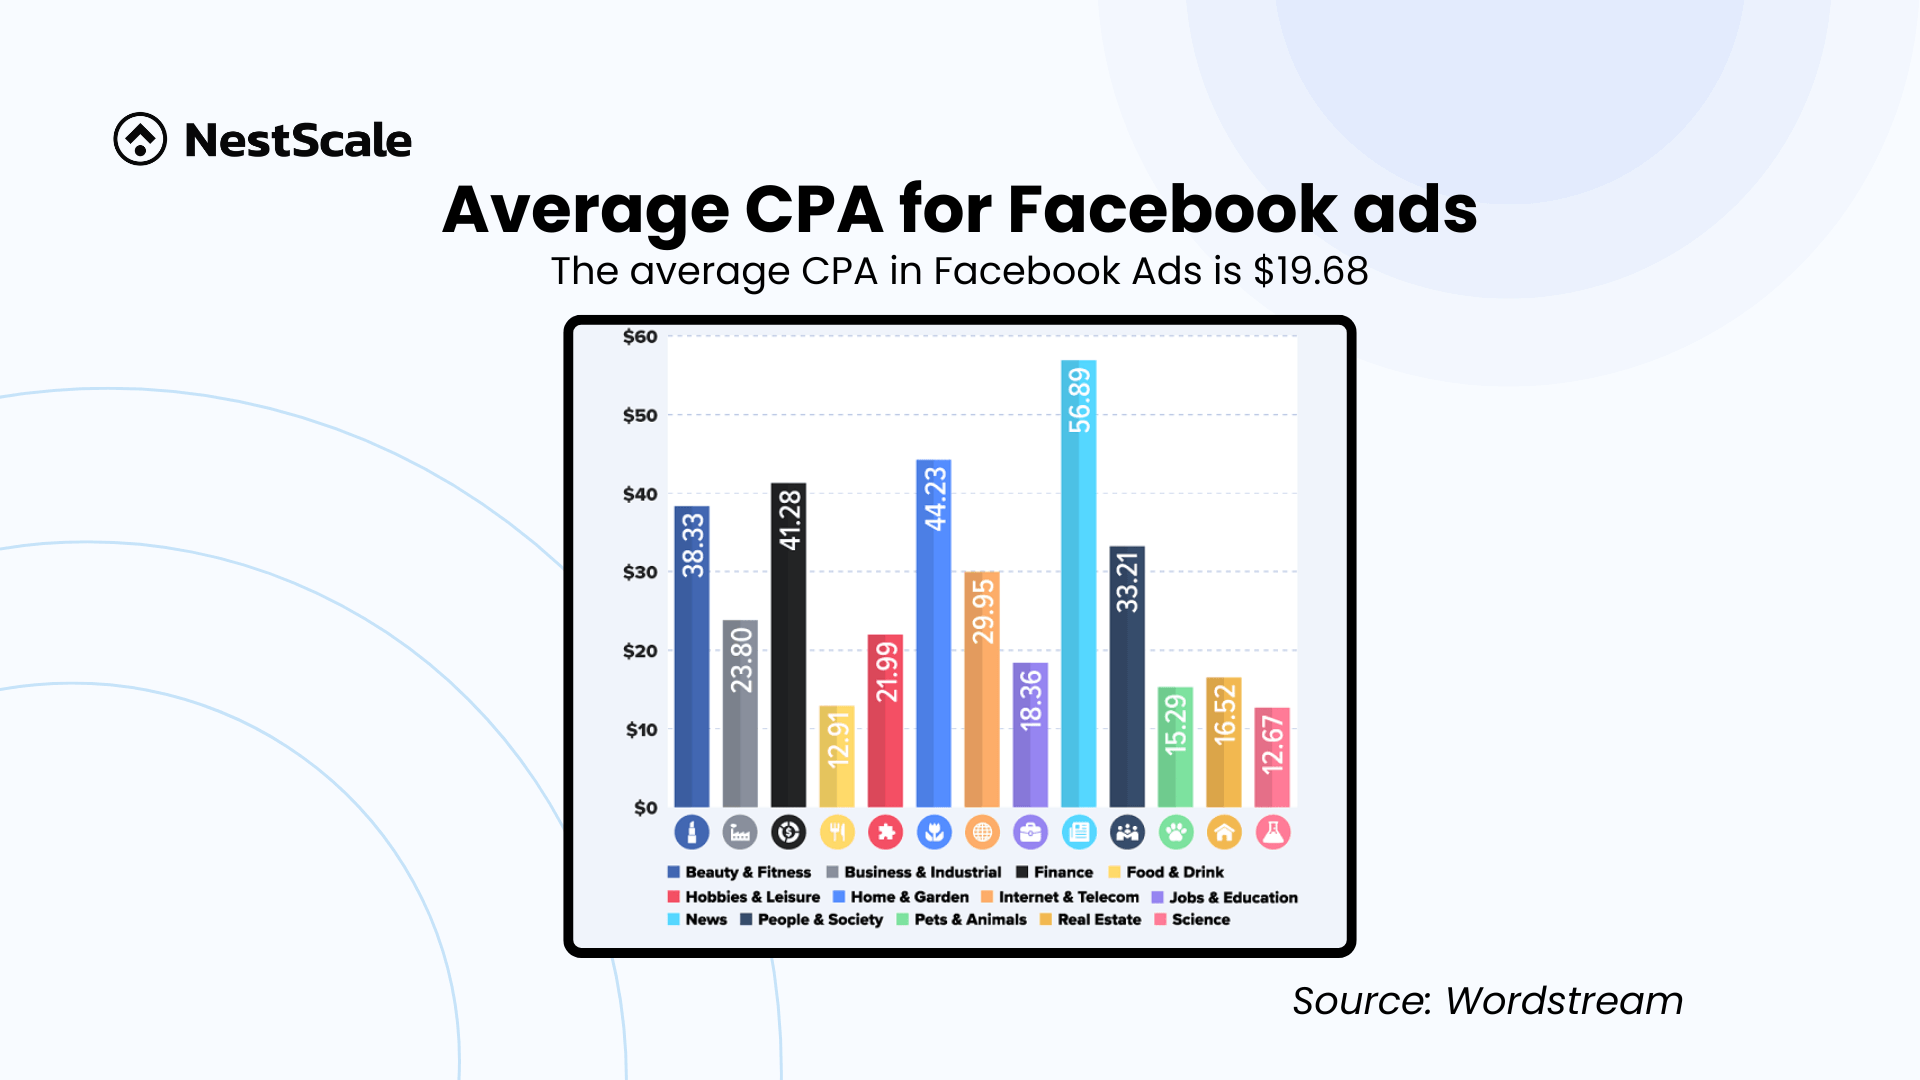
Cost per acquisition (CPA) is the amount you spend to acquire a new customer for your store. It’s a crucial metric for businesses running Facebook ads because it directly reflects how effectively your ads are driving revenue. According to Wordstream, the average CPA on Facebook Ads across all industries is $19.68.
Facebook ads cost per lead
The cost-per-lead (CPL) metric measures the average cost of acquiring a single user’s contact information, such as through a newsletter signup or a quote request. On Facebook, the average CPL hovers around $21.00.
This benchmark varies widely based on the complexity of the consumer’s buying journey. Industries with lower-friction decisions, like fitness or entertainment, see much lower costs, often averaging under $8.00 per lead.
On the flip side, high-investment sectors like real estate, finance, or B2B software can expect to pay upwards of $45.00 per lead, as buyers require significant nurturing before they are willing to share their personal information.
Facebook ads cost per engagement
The cost-per-engagement (CPE) metric quantifies how much you pay each time a user interacts with your ad, whether they like, comment, share, or click on it. Because engagement is a relatively low-friction action, the average CPE on Facebook is highly affordable, typically averaging $0.12.
Highly visual and lifestyle-oriented industries, like travel and media, enjoy the lowest engagement costs, frequently dropping below $0.05 per interaction. Meanwhile, niche markets like legal services or enterprise technology experience higher CPEs, often reaching $0.30 or more, because their content is designed for a highly specific, professional audience rather than broad social sharing.
3. What factors affect your Facebook ads cost?
Several factors influence how much you’ll pay for your Facebook ads. Understanding these can help you manage and optimize your ad budget effectively.
Ad quality and relevance
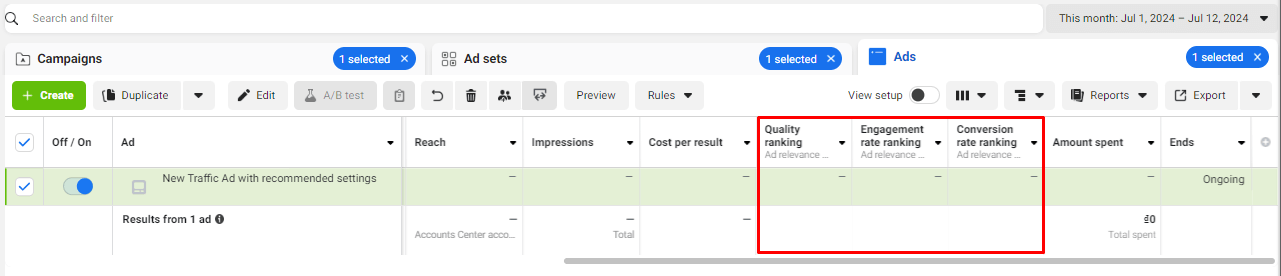
Facebook uses a metric called Quality Ranking (formerly known as the Relevance Score) to evaluate the quality and relevance of your ads. This metric is crucial because ads with higher quality rankings are more likely to win auctions and incur lower costs. Essentially, a high-quality ranking indicates that your ad is more competitive and effective in reaching your target audience compared to others.
You can view these scores in the Ads tab of Meta Ads Manager. Instead of continually creating new ads, focus on improving the scores of your existing ads that have below-average ratings. This approach can be more cost-effective and yield better overall performance.
Target audience
The size and characteristics of your target audience play a significant role in ad costs. Niche audiences might cost more to reach due to limited availability, while broader audiences can sometimes lower your CPC but may not convert as well. Use Facebook’s targeting options to refine your audience and find the right balance.
Ad bidding types
Facebook offers several bidding options, including manual bidding, spend-based bidding, and goal-based bidding. Automatic bidding options, such as spend-based and goal-based bidding, allow Facebook to optimize your bids to achieve the best results. While Facebook claims that its automated bidding can help you make the most of your budget, it’s important to be cautious. Sometimes, automatic bidding might focus more on spending your budget rather than achieving your desired goals.
Manual bidding, on the other hand, gives you more control over your ad spend but requires a deeper understanding of your campaign metrics. This option allows you to set specific bid amounts for your ads, giving you the flexibility to manage costs more precisely.
Ad format and placement
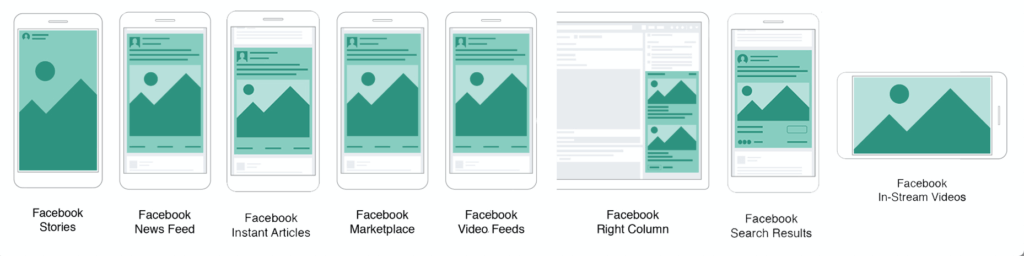
Ad placement refers to where your ads are displayed within Facebook and Meta’s broader ecosystem, including platforms like Instagram, Messenger, and the Audience Network. The cost of your ads can vary significantly based on their placement. For instance, ads appearing in the Facebook News Feed typically cost more than those in the right column or Instagram Stories.
Time of the year
Seasonality affects ad costs. For example, ad costs generally increase during peak shopping seasons like Black Friday, Cyber Monday, and the holiday season due to heightened competition. Plan your budget accordingly to account for these fluctuations.
4. How to reduce your Facebook ad cost
Optimizing your Facebook ad spend involves several strategies. Here are some actionable tips to help you lower your ad costs while maintaining or even improving performance:
Choose the right objective
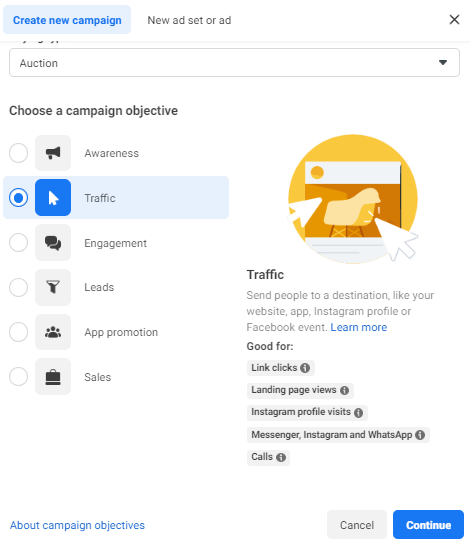
Selecting the appropriate ad objective is crucial. Ensure that your objective aligns with your campaign goals. For instance, if your goal is to drive traffic to your website, choose the Traffic objective rather than Engagement.
Narrow down your audience
Refining your audience targeting can significantly reduce costs. Use custom audiences to target users who have already interacted with your brand and lookalike audiences to reach new users similar to your best customers.
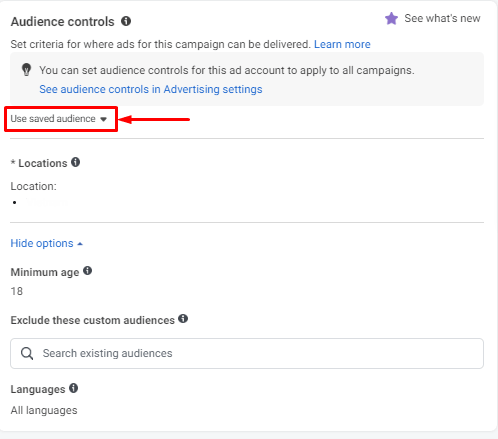
You can also add more filters to narrow down your audience. However, be careful not to add too many conditions, as this can make it difficult for Facebook to find the right audience segment for you. If this happens, your ads might not reach enough people, leading to an unspent ad budget.
Lower your ad frequency score
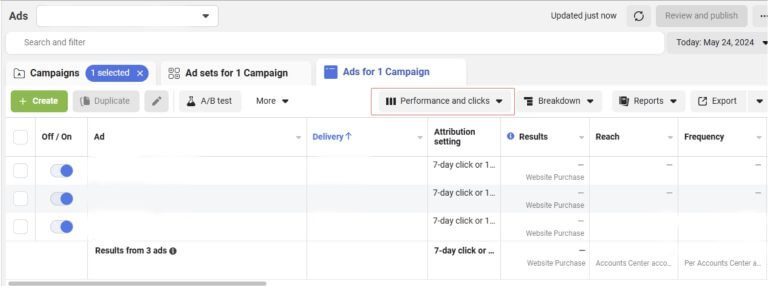
High ad frequency can lead to ad fatigue, where users see your ad too often and start ignoring it. To prevent this, monitor your ad frequency and adjust your budget or refresh your ad creatives to keep your audience engaged. You can find this metric in the Performance column of your campaign, ad set, or ad level reports.
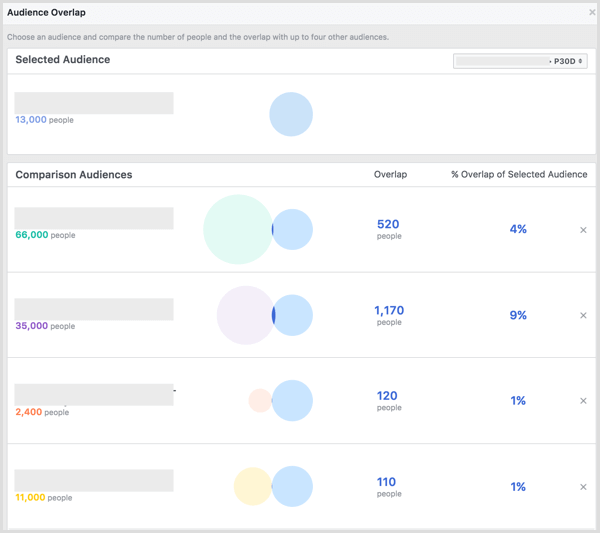
Additionally, use the Audience Overlap tool to check if your different ad sets are targeting overlapping audiences. Navigate to your Facebook Ads Manager audience page, select the specific audiences you want to compare by checking the boxes, click on the More button (three dots), and choose Show Audience Overlap. By adjusting your targeting to minimize overlap, you can reduce ad frequency and maintain a more engaged audience.
Make your campaign relevant
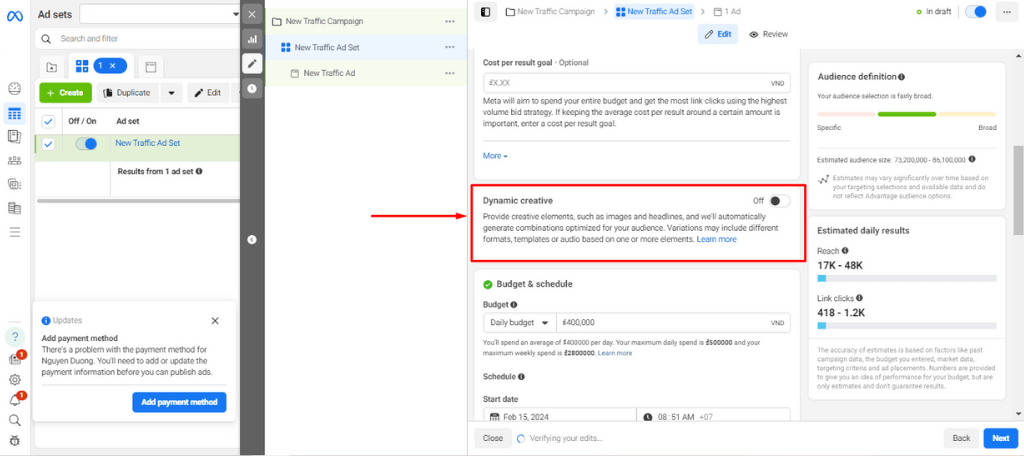
Ensure your ads are relevant to your target audience. Use Facebook’s dynamic creative optimization feature to automatically show the right products to the right people based on their interests and behaviors.
Test your ad regularly
Monitoring and testing your Facebook ads regularly is key for merchants to optimize both ad performance and budget. Don’t leave your success to chance—make sure your ads are reaching the right audience and getting the results you want. Use Facebook ad analysis tool for Shopify – NestAds to track your ad metrics, adjust your strategies, and achieve better outcomes.
NestAds is designed to simplify your marketing efforts across multiple platforms. By centralizing data and providing detailed insights into important metrics like CPA and conversion rates, NestAds helps you make informed decisions and refine your ad budgets effectively.
If you’re ready to boost your advertising strategy and get amazing results, see what NestAds can do for you. Unlock the full potential of your Facebook Ads with NestAds today!
👉 Related:
Facebook Ads Campaign Structure: How to Set It Effectively
FAQs: Facebook Ads Cost
It’s completely free to set up a basic Facebook Business Manager or Meta Business Suite account. However, if you want premium features like the blue verification checkmark and direct customer support, Meta offers an optional Meta Verified for Business subscription that scales from $14.99 to $349.99 per month depending on the tier you choose.
Strictly speaking, Facebook Ads feature a much lower cost per click (CPC) than Google Search Ads. The cross-industry average CPC on Facebook sits around $0.70 to $1.10, whereas Google Search Ads average between $2.00 and $5.00+ per click.
However, cheaper clicks don’t automatically equate to cheaper customers. Google Ads captures high purchase intent from users actively searching for a solution, yielding higher conversion rates, while Facebook excels at building awareness and generating brand discovery at a much lower baseline media cost.
In the UK, the average Facebook cost per click (CPC) hovers between £0.92 and £1.50, with a steady median of about £1.11. Additionally, Meta applies a location-specific regulatory delivery fee of 2% to 5% on top of UK ad invoices.
Facebook Marketplace is completely free for local sales, meaning you pay zero platform fees if a buyer picks up an item in person and pays you via cash or a private peer-to-peer app. However, if you utilize Facebook’s built-in checkout system to ship an item, Meta charges a 5% selling fee per shipment (or a flat $0.40 minimum for low-value transactions under $8).
You can boost a Facebook post for as little as $1 per day, which is Meta’s absolute minimum requirement for basic reach and awareness campaigns. While a tiny $5 total budget will buy you a few thousand impressions, it won’t yield meaningful sales data. For local businesses or brands looking to gain genuine traction on a post, a realistic baseline benchmark is to allocate $10 to $20 per post over a 3-to-5-day window.
Retargeting ads typically carry a 30% to 50% higher CPM than cold prospecting campaigns. This premium cost exists because you are bidding on a much smaller, highly competitive pool of warm users, such as past website visitors or cart abandoners.