

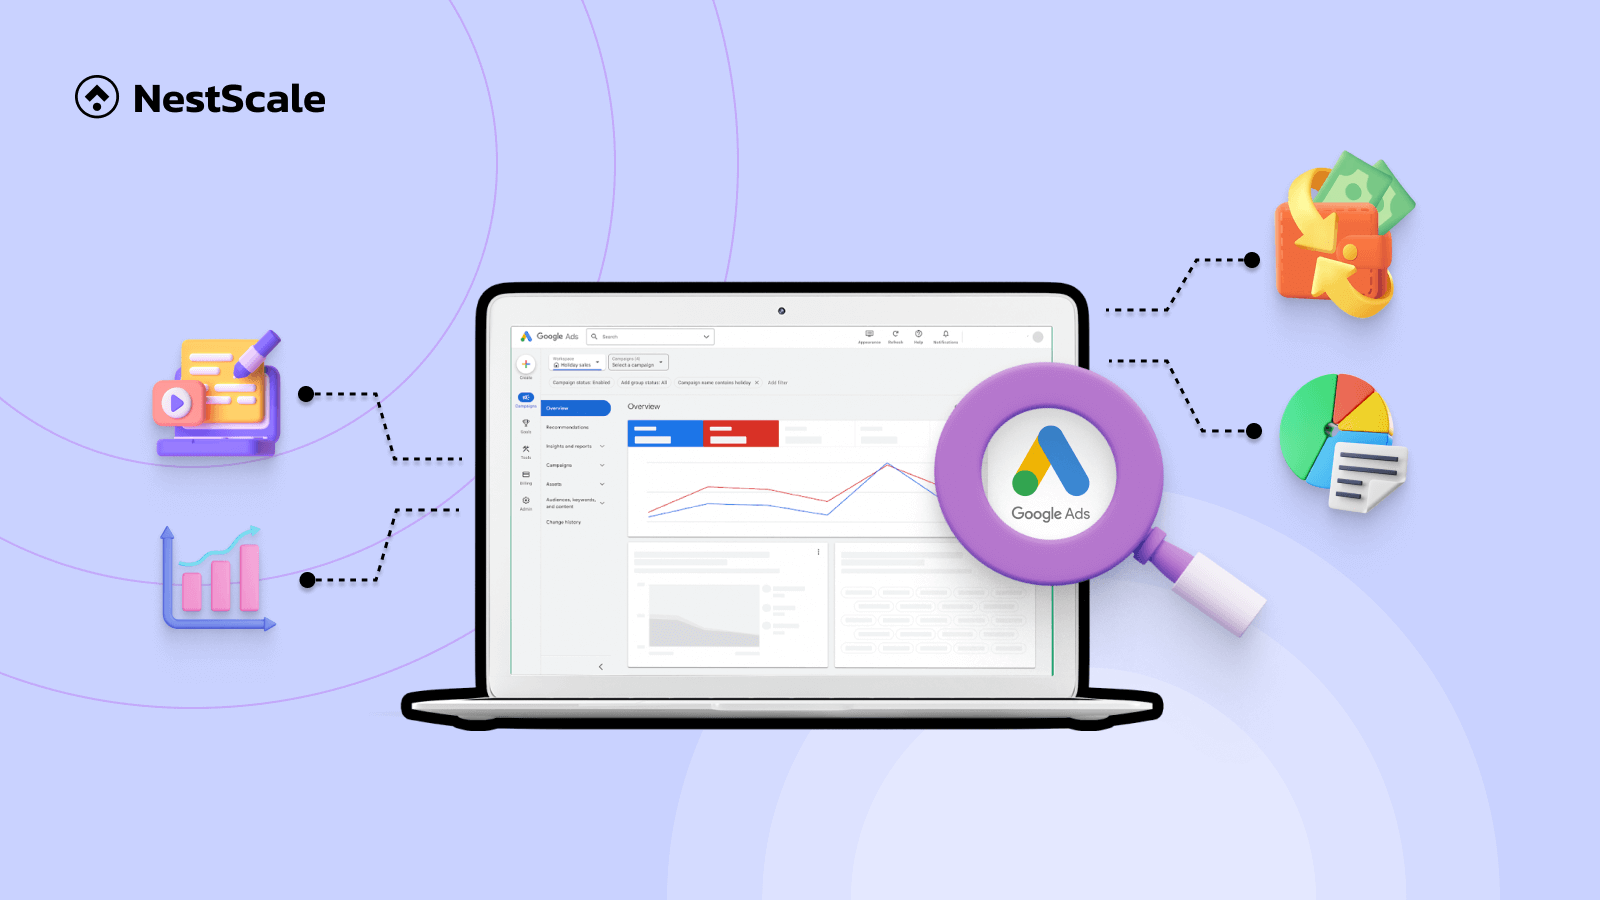
There is always a wonder in every advertiser “How can your Google Ads campaign compare to your competitors?” Or perhaps you’re interested in understanding how your keywords compare to your competitors’ bids or identifying the entities bidding on your brand-specific keywords. Well, if so, you should know about the Auction Insights Report, a valuable resource, in your Google Ads account.
In this article, you’ll be provided with a basic understanding of Auction Insight report to fuel your campaigns with laser-targeted keywords and optimized bids!
What is Auction Insights in Google Ads?
The Auction Insights report is a detailed and downloadable datasheet that gives you a behind-the-scenes look at how your keyword bids are performing in real-time auctions. It’s like having a live feed of the bidding battles your ads are facing, complete with insights on your success and opportunities for improvement.
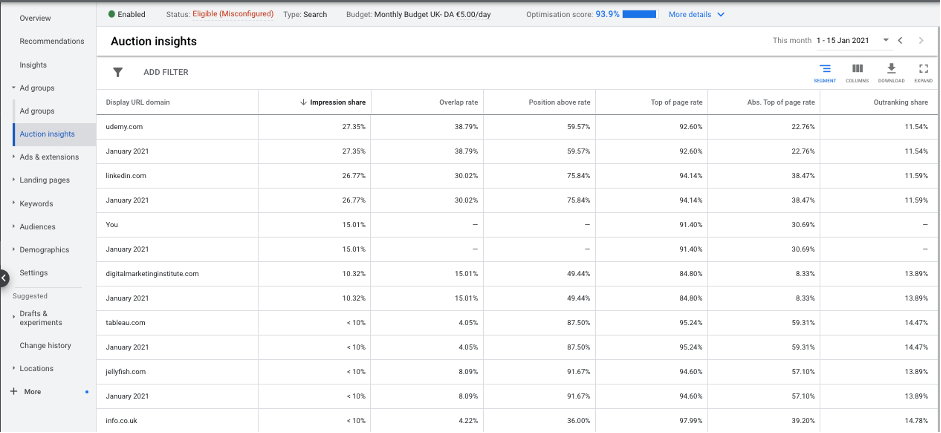
The core is that you can assess the effectiveness of your advertisements, identifying both successful and underperforming areas, along with the extent of their success or shortcomings. Additionally, you can determine instances where your ads are in direct competition with a rival, and ascertain whether your ad emerged as the more successful one or not.
Types of Google ads that Auction Insights available for
As the report can only show you the data from ads that include the bidding process, therefore, among all types of ads available on Google, there are only 3 types of ads that you can see in the Auction Insights report. Those are:
- Search Campaigns
- Shopping Campaigns
- Performance Max campaigns
However, the report won’t be the same. There are disimilarities in the metrics shown in the report of each 3 types. Take a look at the below table to see how they are different from each other.
| Search Campaigns | Shopping Campaigns | Performance Max Campaigns | |
| Impression share | x | x | x |
| Overlap rate | x | x | x |
| Outranking share | x | x | x |
| Position above rate | x | ||
| Top-of-page rate | x | ||
| Absolute top-of-the-page rate | x |
Explanation of metrics in the Auction Insights Report
After seeing your Auction Insights report, let’s dive deep into 6 core metrics to master in reading Auction Insight data.
Impression share
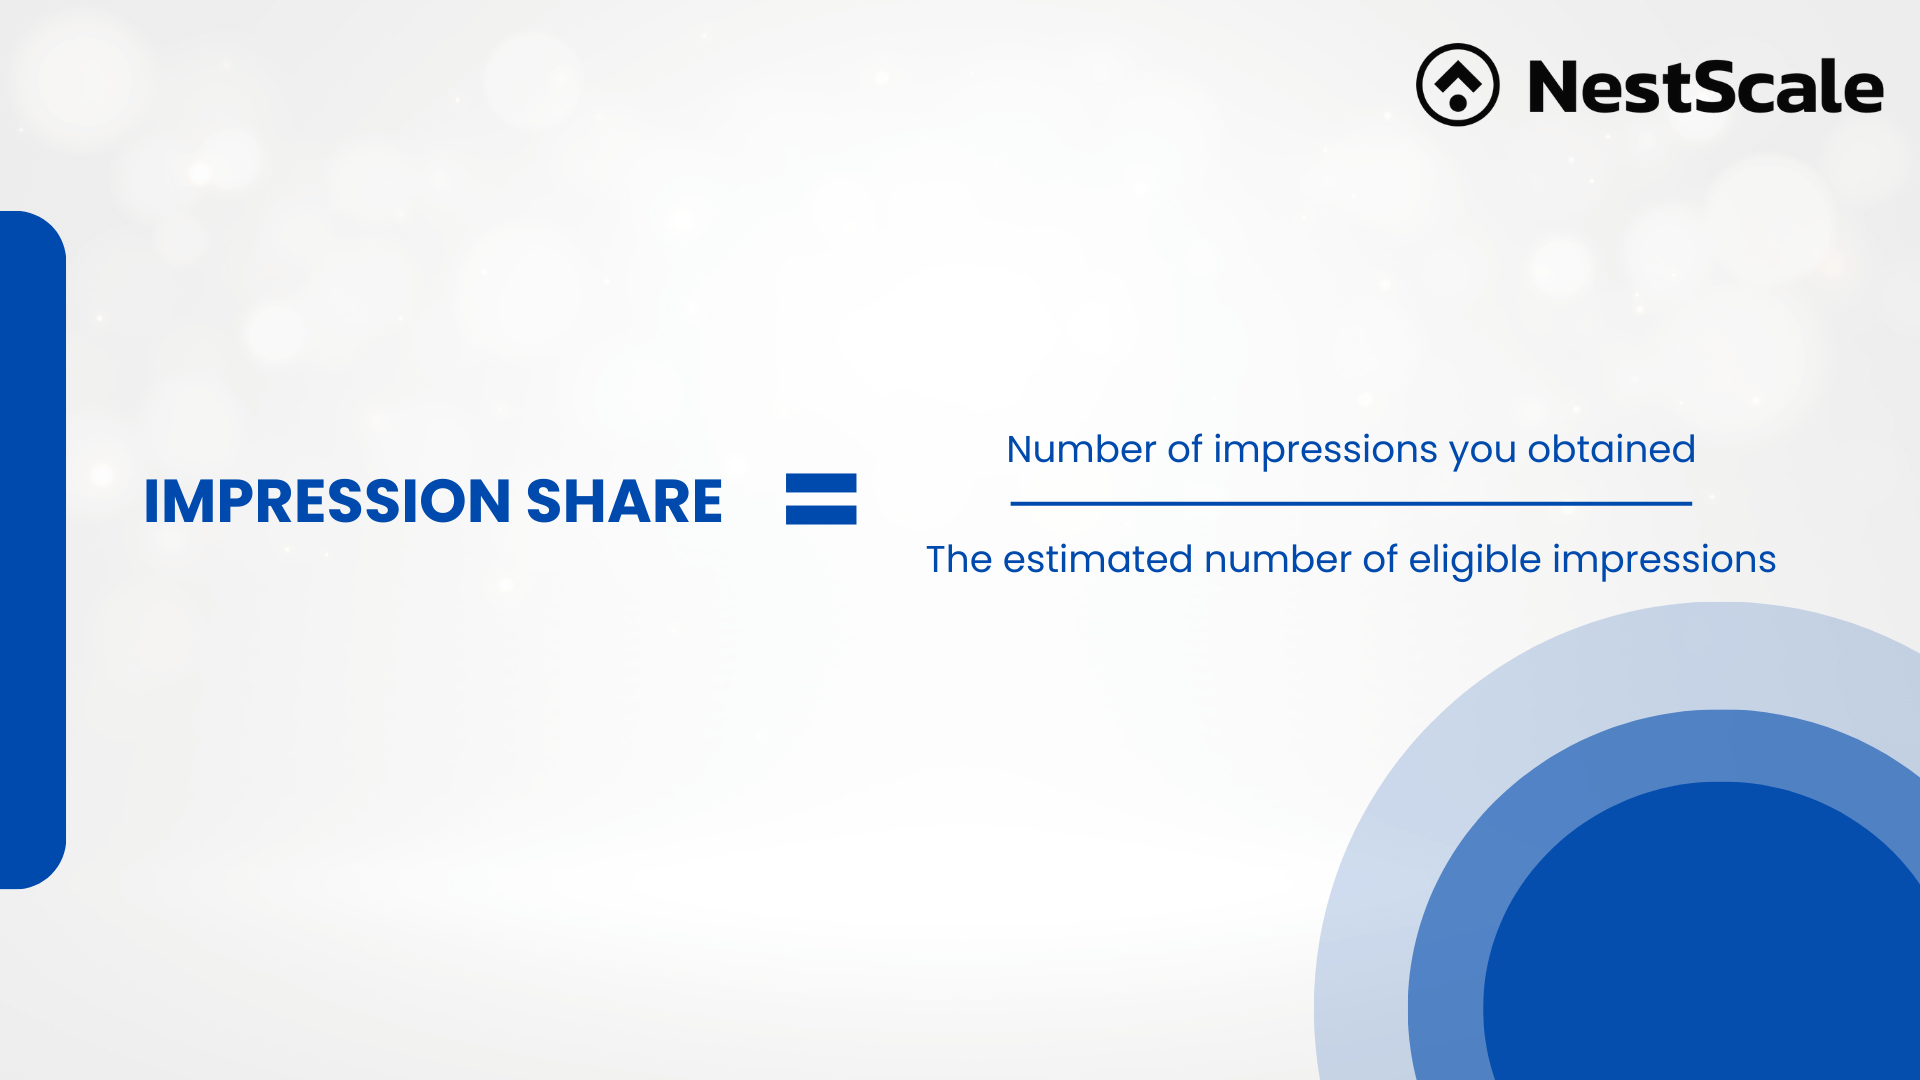
Impression share tells you how often your ad is displayed compared to the total number of times it could have potentially shown up. In simpler terms, it tells you how visible your ad is in the auctions it participates in.
Impression share is calculated by dividing the number of impressions you obtained by the estimated number of impressions you were eligible to receive. Take an example, if your ad received 1000 impressions from a potential total of 10,000 then you’d have an impression share of 10%.
- Impression: Every time your ad appears on a search engine results page (SERP) or other targeted location (depending on your campaign settings) counts as an impression.
- Total eligible impressions: This refers to the total number of times your ad could have potentially shown up in all the auctions it was eligible for during the selected timeframe. Your current ads’ targeting settings, approval statuses, and Quality Scores might affect eligibility.
Monitoring your impression share over time allows you to assess whether your ads achieve their maximum reach and to gauge their performance in comparison to your competitors.
Overlap rate
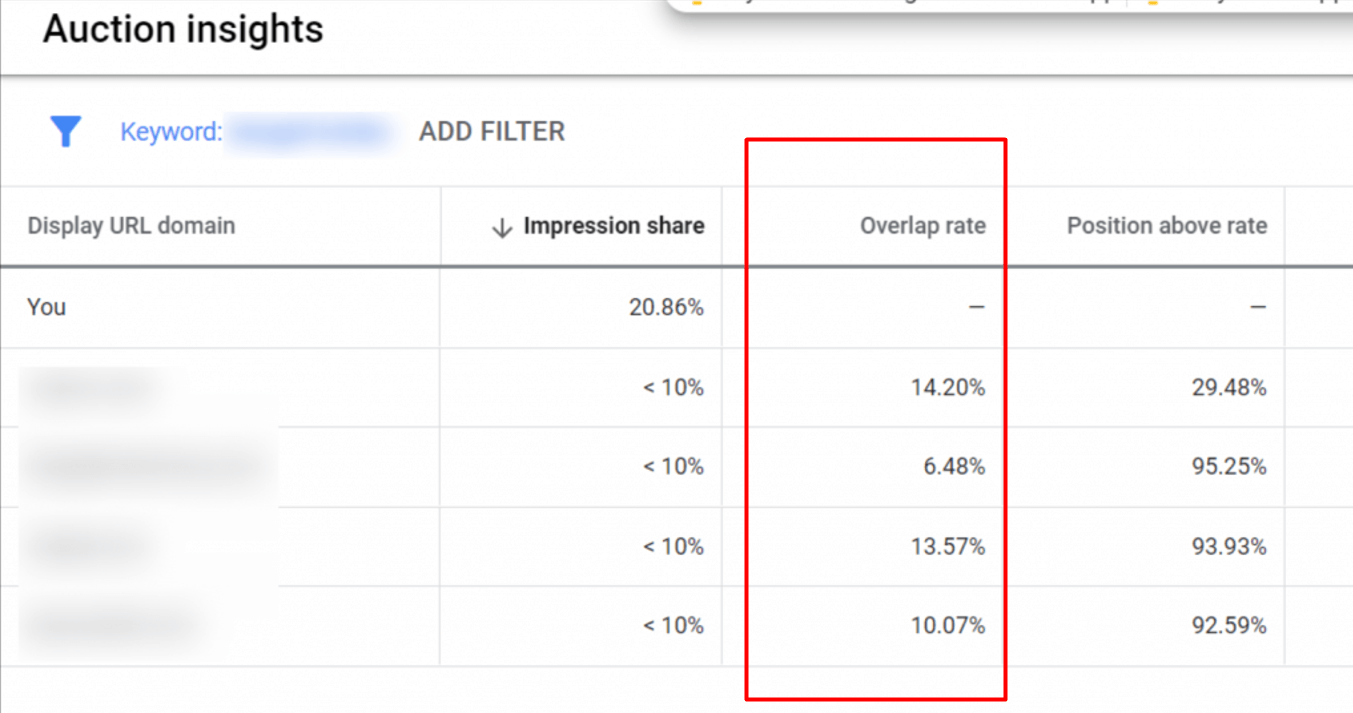
In the Auction Insights report of Google Ads, the overlap rate refers to the percentage of times your ad and another competitor’s ad were both eligible to be shown in the same auction and displayed.
If a competitor in your auction insights report displays a 40% overlap rate, for example, it indicates that in 4 out of every 10 instances your ad appeared, their ad also appeared. It’s essentially a measure of how often you’re facing off against specific competitors in the bidding process.
Outranking share
Outranking share in Google Ads is a powerful metric that tells you how often your ad ranked higher above a specific competitor’s ad in the auctions you both participated in. It goes beyond just showing up, focusing specifically on who tops the SERP when you directly confront another advertiser.
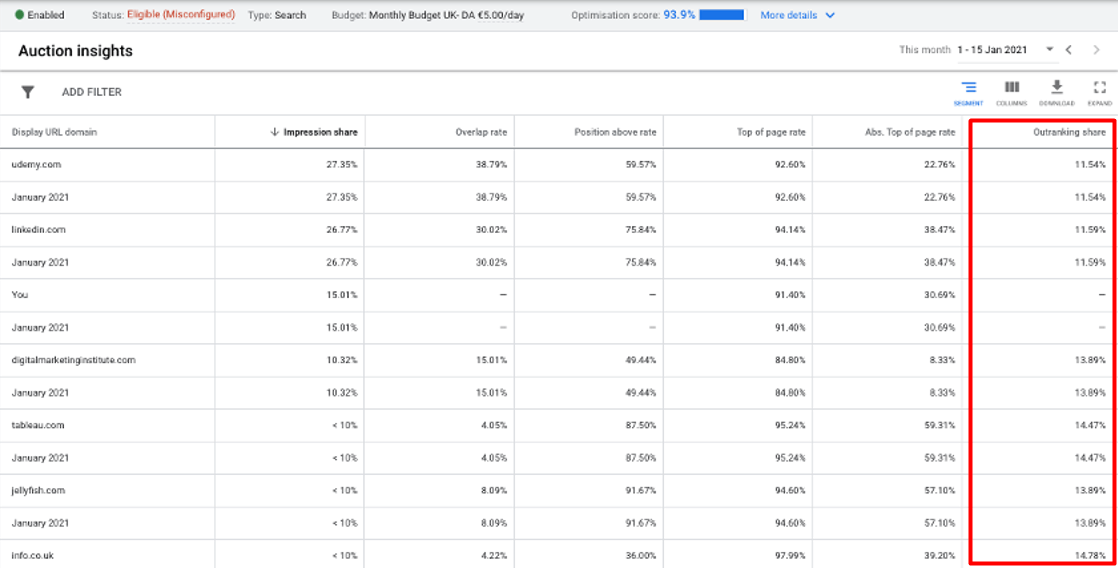
This metric calculates the percentage of times your ad ranked higher than the chosen competitor’s ad in the auctions you both were eligible for. So, if your outranking share for a specific competitor is 60%, it means that your ad outperformed theirs in 2 out of every 10 instances when both ads were present, or in 20% of the auctions where both ads participated.
Position above rate
Like outranking share, this percentage indicates the frequency with which your competitor’s ad appeared higher than yours in one-on-one bid situations. It’s important to note that this metric applies only to paid search campaigns.
If you observe a competitor’s position above rate at 30%, it signifies that their ad has a higher ranking than yours in 30% of the search engine results pages (SERPs) where both of your ads were present.
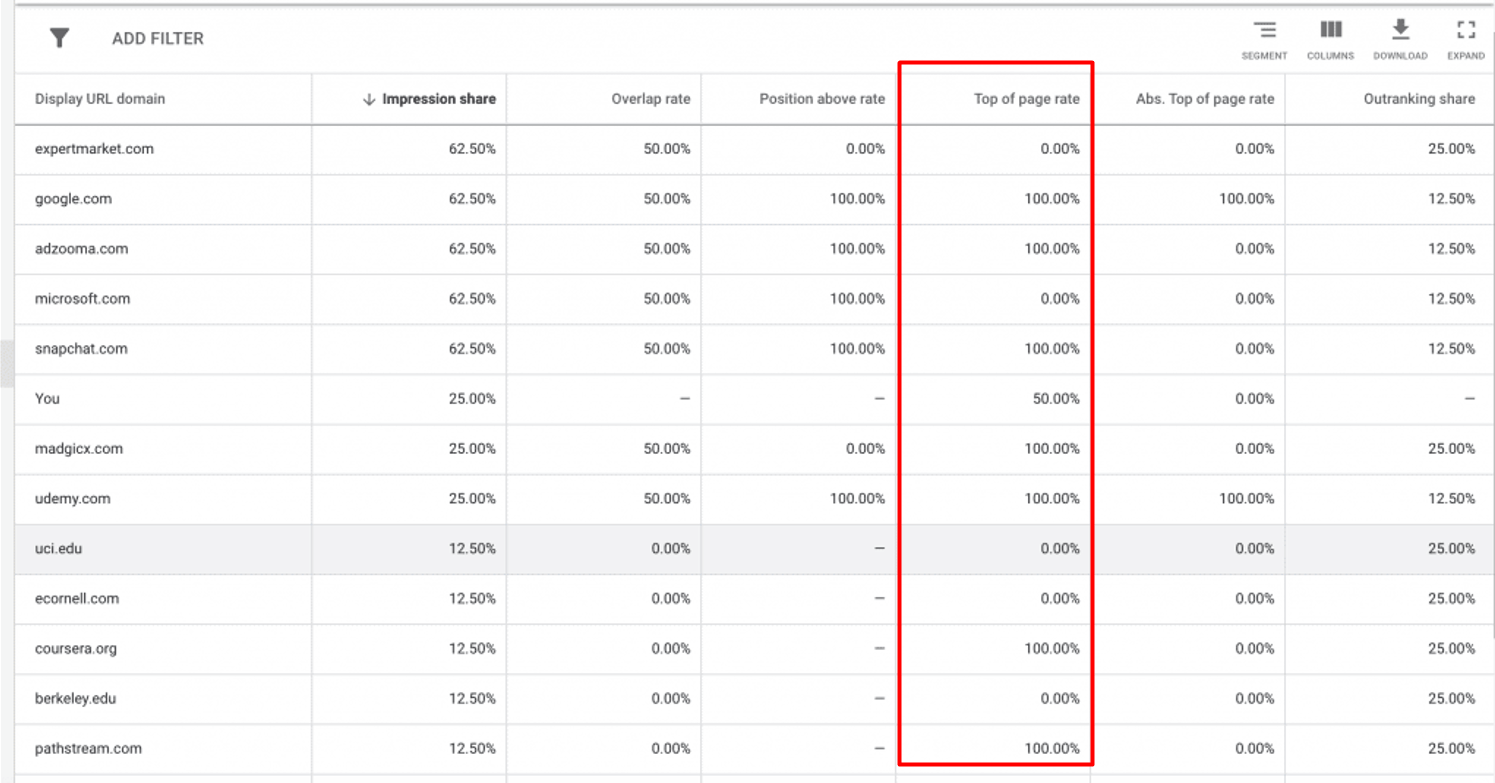
Top-of-page rate
The Top of Page Rate (TPR) is a metric that represents the percentage of times your ad is shown at the top of the search results page, above the unpaid search results, when someone searches for one of your keywords. A high TPR indicates that users are more likely to click on an ad when it is displayed at the top of the page, which can lead to increased traffic and conversions.
Absolute top-of-the-page rate
The absolute top-of-the-page rate informs you about the frequency with which your ad (or another advertiser’s ad, depending on the specific row) appeared at the absolute top of the page, positioned as the very first ad above the organic search results.
You’ll be informed about the frequency of your ad reaching the top position. Advertisers can leverage this data to enhance the visibility of their ads at the very top of the page, subsequently increasing the potential for clicks and conversions.
How to see Auction Insights report in Google Ads
To access your Auction Insights and start your discovery, follow these steps:
1. Go to your Google Ads account
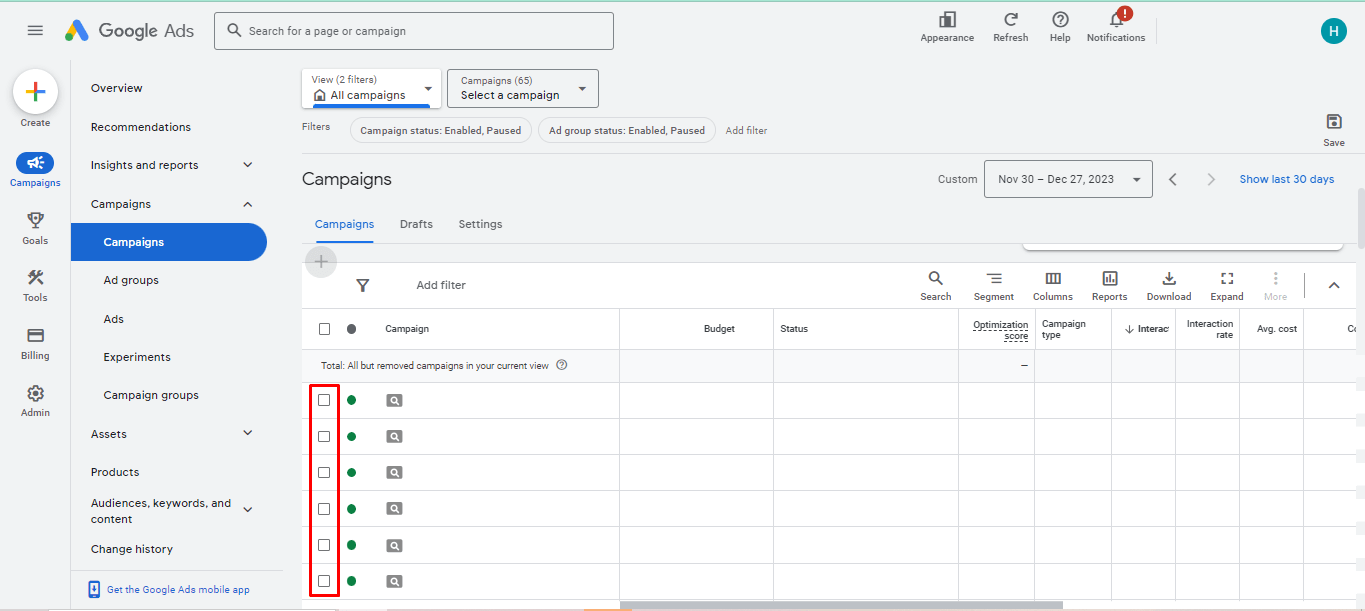
2. Navigate to the page for Campaigns, Ad groups, or Search keywords, depending on the specific information you intend to examine in the report.
3. Choose a particular campaign, ad group, or keyword by marking the checkbox next to each item.
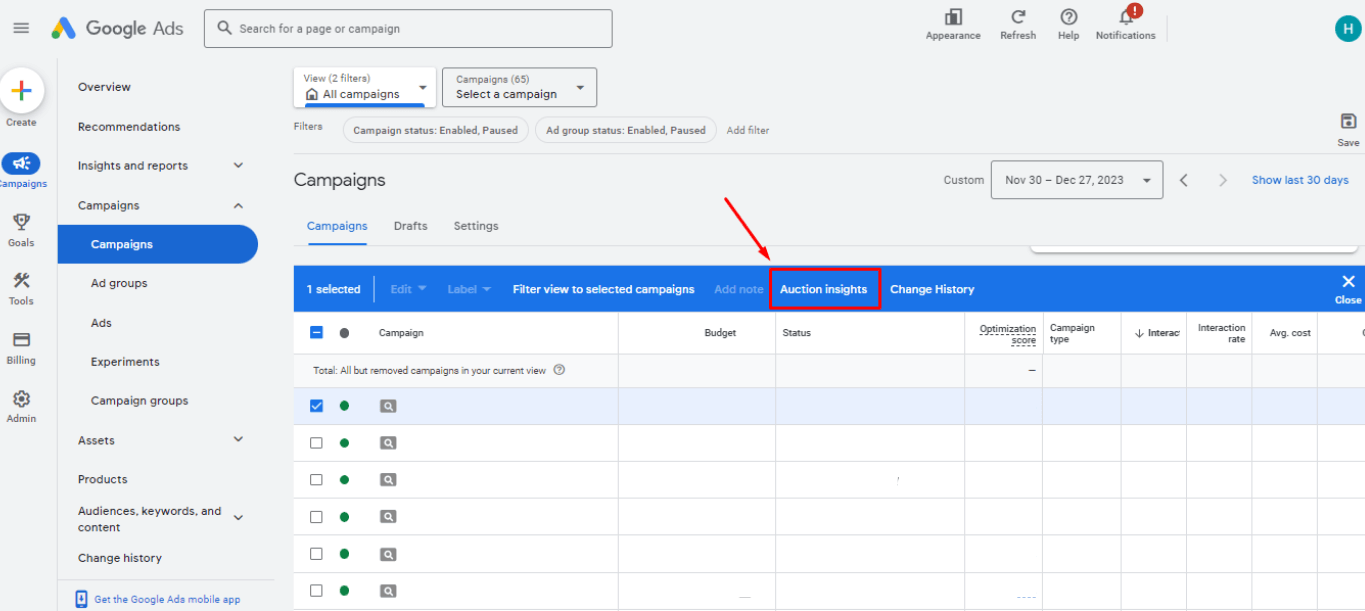
4. Tap into Auction Insights.
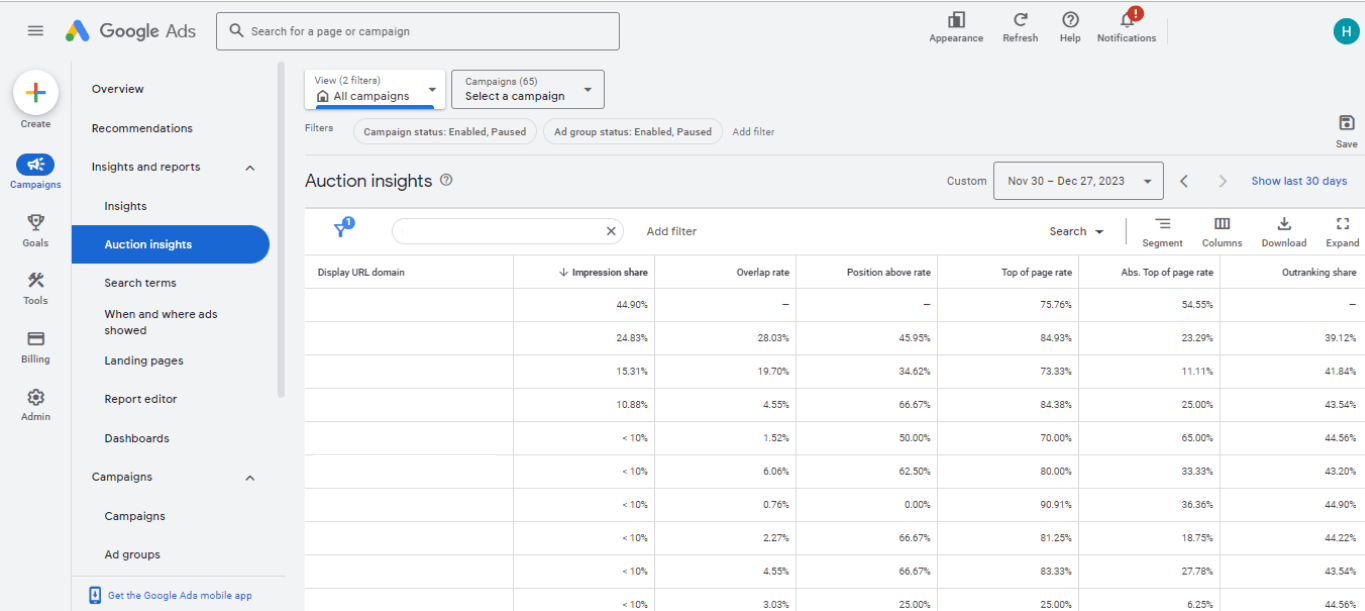
5. You’ll now be taken to your auction insights report:
- Choose Search, Shopping campaigns, or ad groups separately: find the corresponding auction insights report.
- Choose a combination of Search, Shopping, or Performance Max campaigns: Pick either Search campaigns or Shopping campaigns from the dropdown menu. This will segment the Performance Max ad impressions and the associated auction insights data for each channel into Search or Shopping options.
Besides, you can also create or use the filters to locate keywords, ad groups, and campaigns that have auction insights reports available by clicking the filter icon above your statistics table.
How can you utilize Auction Insights data?
The Google Ads Auction Insights report provides extensive information on how your Google Ads campaign compares to competitors. Analyzing this data enables advertisers to identify necessary adjustments, such as refining bidding strategies, to enhance performance and maintain competitiveness in the market. So, with the mass data in hand, you can:
Identify key competitors and their strategies
Recognizing the frequency of your ad displays relative to competitors is essential, providing valuable insights into your campaign’s efficacy and competitive position in the market. From the below data, you can get a thorough understanding of your competitors, and your market, also:
- Impression Share: reveals the percentage of your ad impressions relative to eligibility, aiding in assessing market visibility compared to competitors. Low Impression Share could suggest restrictions in budget or bids, low ad quality, or unexplored keyword possibilities.
- Overlap rate: See who you compete against most frequently and assess their impact on your performance. Use filters to isolate high-overlap keywords and analyze competing bids, ad rank factors, and ad copy to understand their tactics.
- Outranking share: Gauge how often you beat specific competitors in terms of ad position.
- Average position: Compare your ad placements against competitors to identify potential areas for improvement.
Improve ad relevance and quality
When interpreting the Auction Insights Report, you will figure out the way to make your ads become more relevant and boost their quality.
Let’s say, track your ad’s reign in the coveted top SERP spot with Absolute Top Impression Rate, the ultimate measure of prime visibility. This is where clicks and conversions truly flourish. But the journey starts higher up – Top of Page Rate tells you how often your ad rises above the organic search pack, grabbing attention before anyone else.
Finally, compare your Google ads click-through rate (CTR) to your rivals’. This head-to-head analysis reveals where your ad copy or landing pages might need a makeover to truly shine in the spotlight.
Figure out low-competitive opportunities
Selecting optimal keywords demands strategic thinking, and if you’re unfamiliar with the Keyword Planner, referencing your Google Ads Auction Insights report can expedite the process by revealing low-competition keywords. Analyzing this report may unveil differences in keyword choices among competitors, offering insights into their strategies and allowing you to navigate the market more effectively. Examining competitors’ rankings in specific keywords through Google Auction Insights helps identify low-competition opportunities, potentially reducing bidding costs and presenting a valuable investment.
Optimize bidding strategies
Analyzing the metrics presented in Google Ads auction insights allows advertisers to identify opportunities for optimization, such as surpassing competitors, enhancing impression share, or elevating Ad Rank. This analysis empowers advertisers to refine bidding strategies and enhance targeting outcomes. Especially, when optimizing your bidding strategies based on the data from the report, you should concentrate on these metrics:
- Position above rate: Understand how much you may need to bid to outperform certain competitors consistently.
- Overlap rate: Again, but with this function, the overlap rate helps you to adjust bids for keywords where the overlap is high to gain an edge in those auctions.
- Impression share (lost due to rank): Increase bids or improve ad quality to address lost impressions due to low rank
In conclusion, Auction Insights is your key to sustainable success in the ever-evolving world of online advertising. By staying informed, adapting to the landscape, and constantly iterating your campaigns, you’ll ensure your ads always stay ahead of the curve. Remember, the auction is a continuous game, so keep learning, analyzing, and optimizing for even greater heights.