Google Analytics 4 (GA4) offers a powerful suite of tools designed to provide deeper insights into how customers interact with your online store. By leveraging GA4 e-commerce metrics, businesses can track critical performance indicators, enhance user experience, and make data-driven decisions to boost conversions and revenue.
In this blog, we’ll explore the 9 essential ga4 e-commerce KPIs. Whether you’re new to GA4 or looking to refine your analytics strategy, this guide will help you unlock the full potential of these metrics, offering actionable insights to drive your business forward. Let’s dive in and discover how GA4 can transform your approach to e-commerce analytics and performance optimization.
9 key e-commerce metrics in GA4
In this section, we provide the top 9 GA4 e-commerce metrics, including average order value, total revenue, purchase revenue, conversion rate, shopping cart abandonment, customer retention rate, customer lifetime value, top conversion sources & paths, and engagement rate.
Average order value (AOV)
AOV is one of the crucial GA4 e-commerce metrics that represent the average amount of money customers spend per transaction on your Shopify store. It’s calculated by dividing your total revenue by the number of orders.
By tracking AOV, you can spot the trends and make informed decisions regarding pricing, promotions, and product offerings to optimize revenue.
For example, if your AOV is low, you might consider implementing upselling or cross-selling techniques to encourage customers to purchase additional products. Conversely, if your AOV is high, you might offer discounts on bundled products or free shipping to encourage customers to purchase more frequently.
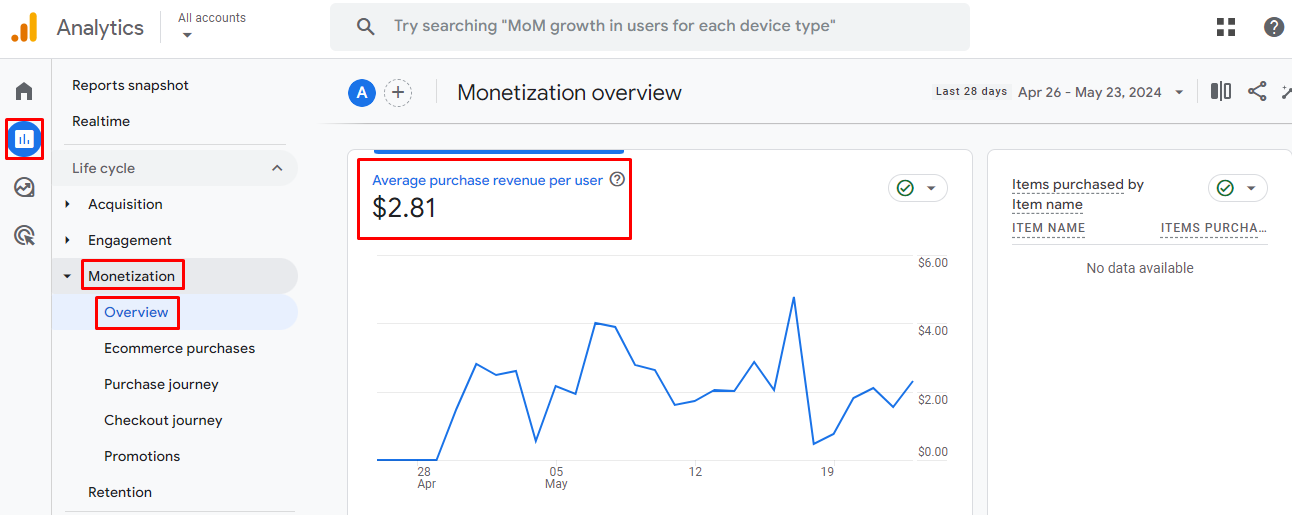
In Google Analytics 4, average order value is referred to as average purchase revenue.
How to track average purchase revenue in GA4
- Navigate to Reports
- Then, click on Monetization section.
- Select Overview.
- Scroll down to the graph displaying Average purchase revenue per user.
Total revenue
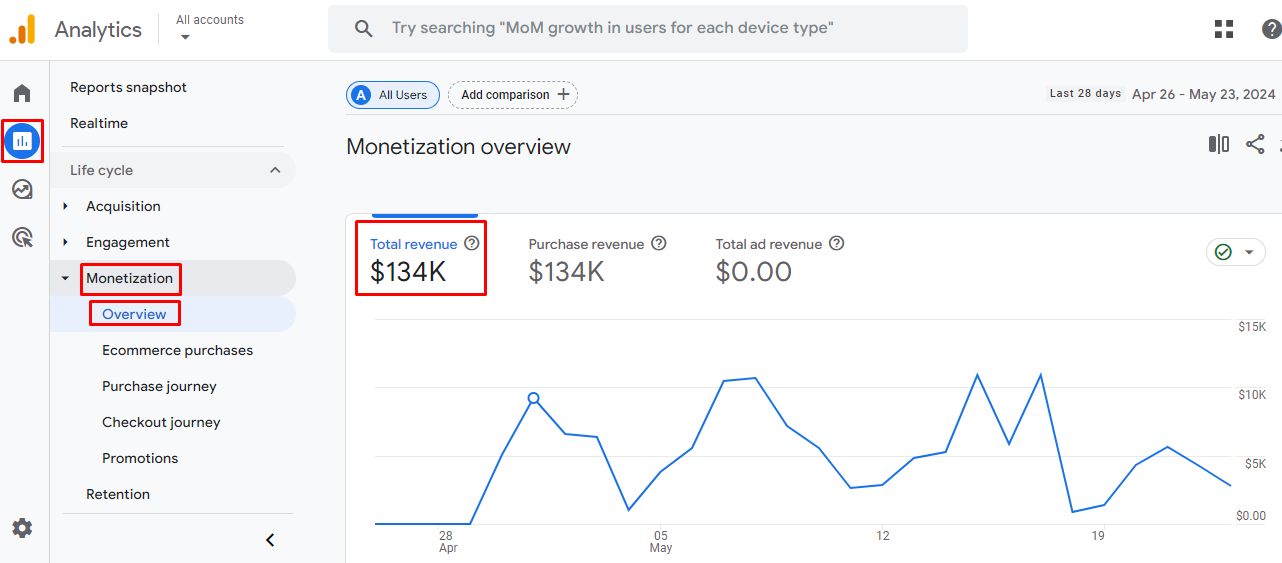
Total revenue represents the complete income generated from all sales transactions on your online store. This metric is comprehensive, encompassing not only the sales of products but also additional charges such as taxes and shipping costs. It provides a holistic view of the financial performance of your e-commerce business. By analyzing this metric, you can assess the effectiveness of your pricing strategies, marketing campaigns, and operational efficiency.
To access the total revenue metric in GA4:
- Go to the Reports tab.
- Navigate to Monetization -> Overview.
- Find the Total Revenue figure, which aggregates income from product sales, taxes, and shipping charges.
Purchase revenue
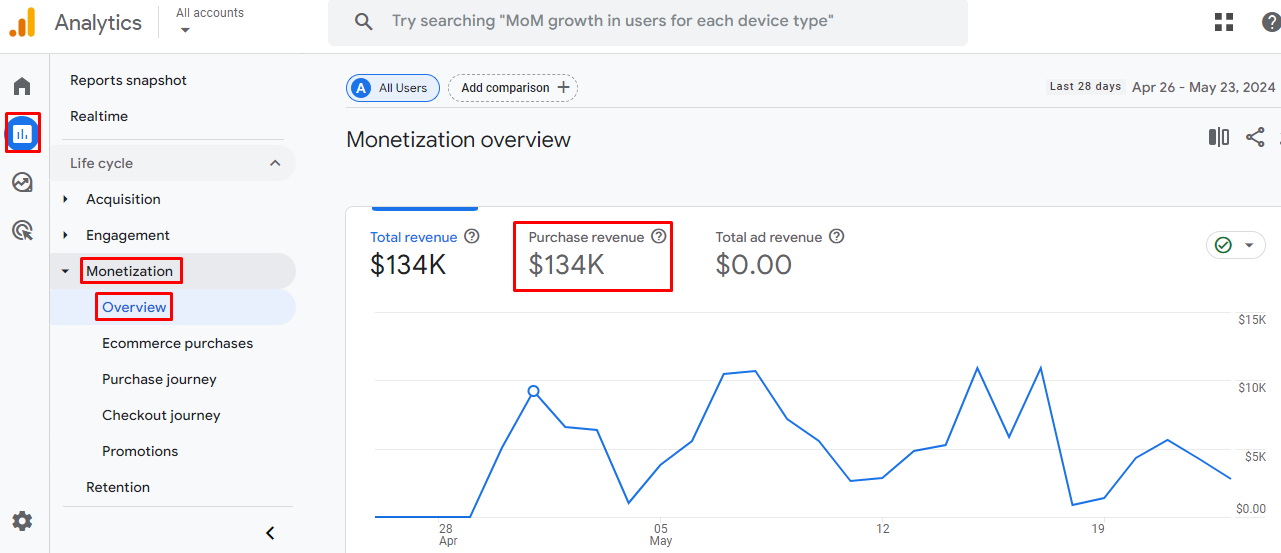
Purchase revenue is one of the vital GA4 e-commerce metrics that represents the total income generated from purchases made on your website or app, after deducting any refunds issued. This metric provides a clear picture of the actual revenue your business retains from sales activities.
This metric provides a net figure, reflecting the actual earnings after accounting for refunds, giving a true sense of business profitability. It also helps you evaluate the success of sales strategies, product offerings, and customer satisfaction levels and assists in accurate financial forecasting and budgeting by providing a realistic view of income.
To access the purchase revenue metric in GA4:
- Go to the Reports tab.
- Navigate to Monetization -> Overview.
- Find the Purchase revenue figure, which aggregates income from all purchase-related activities, minus refunds.
Conversion rate
GA4 e-commerce conversion rate indicates the percentage of website visitors who complete a desired action, such as making a purchase, signing up for a newsletter, or adding items to their cart. Specifically, in the context of e-commerce, it typically refers to the percentage of visitors who make a purchase.
This metric is crucial for understanding the effectiveness of your website and marketing strategies in turning visitors into customers.
How to track conversion rate in GA4
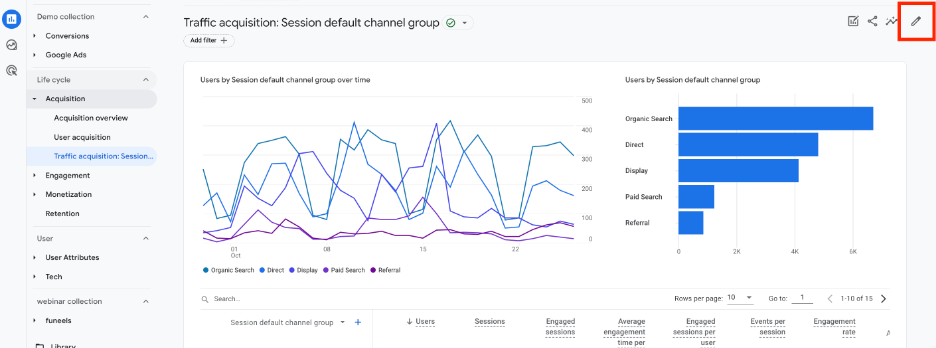
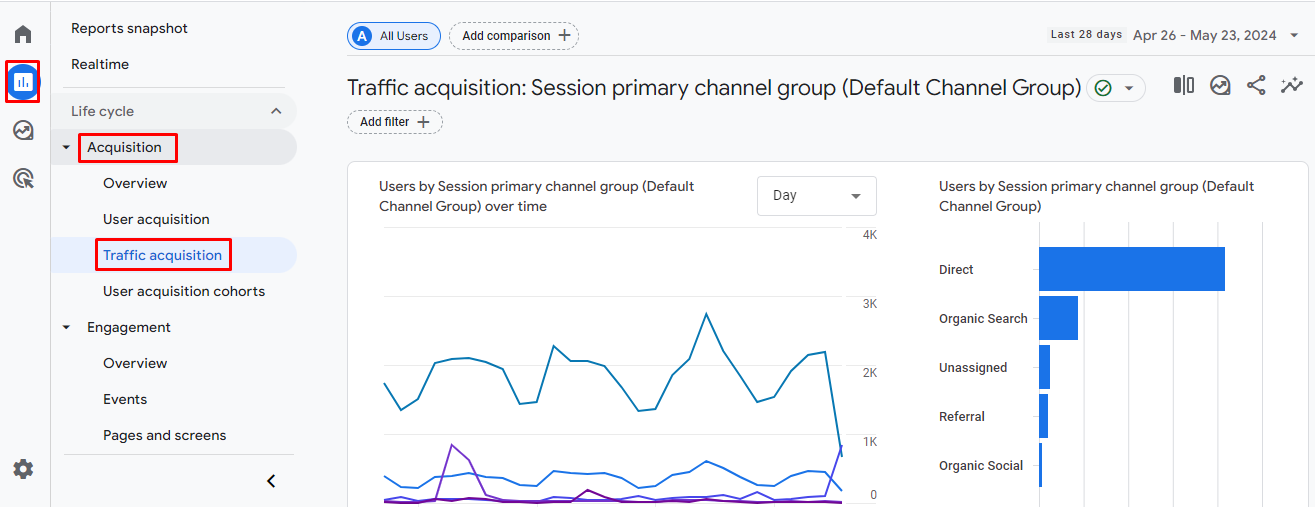
- Go to Reports → Acquisition → Traffic acquisition and click the Pencil icon.
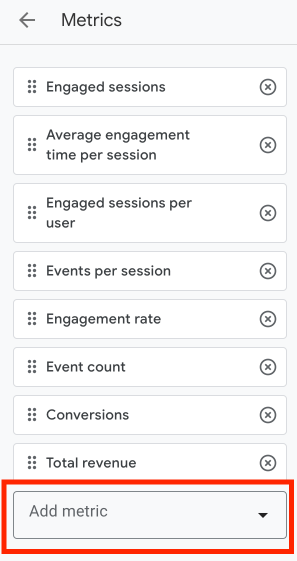
- Then click on Metrics → Add metric.
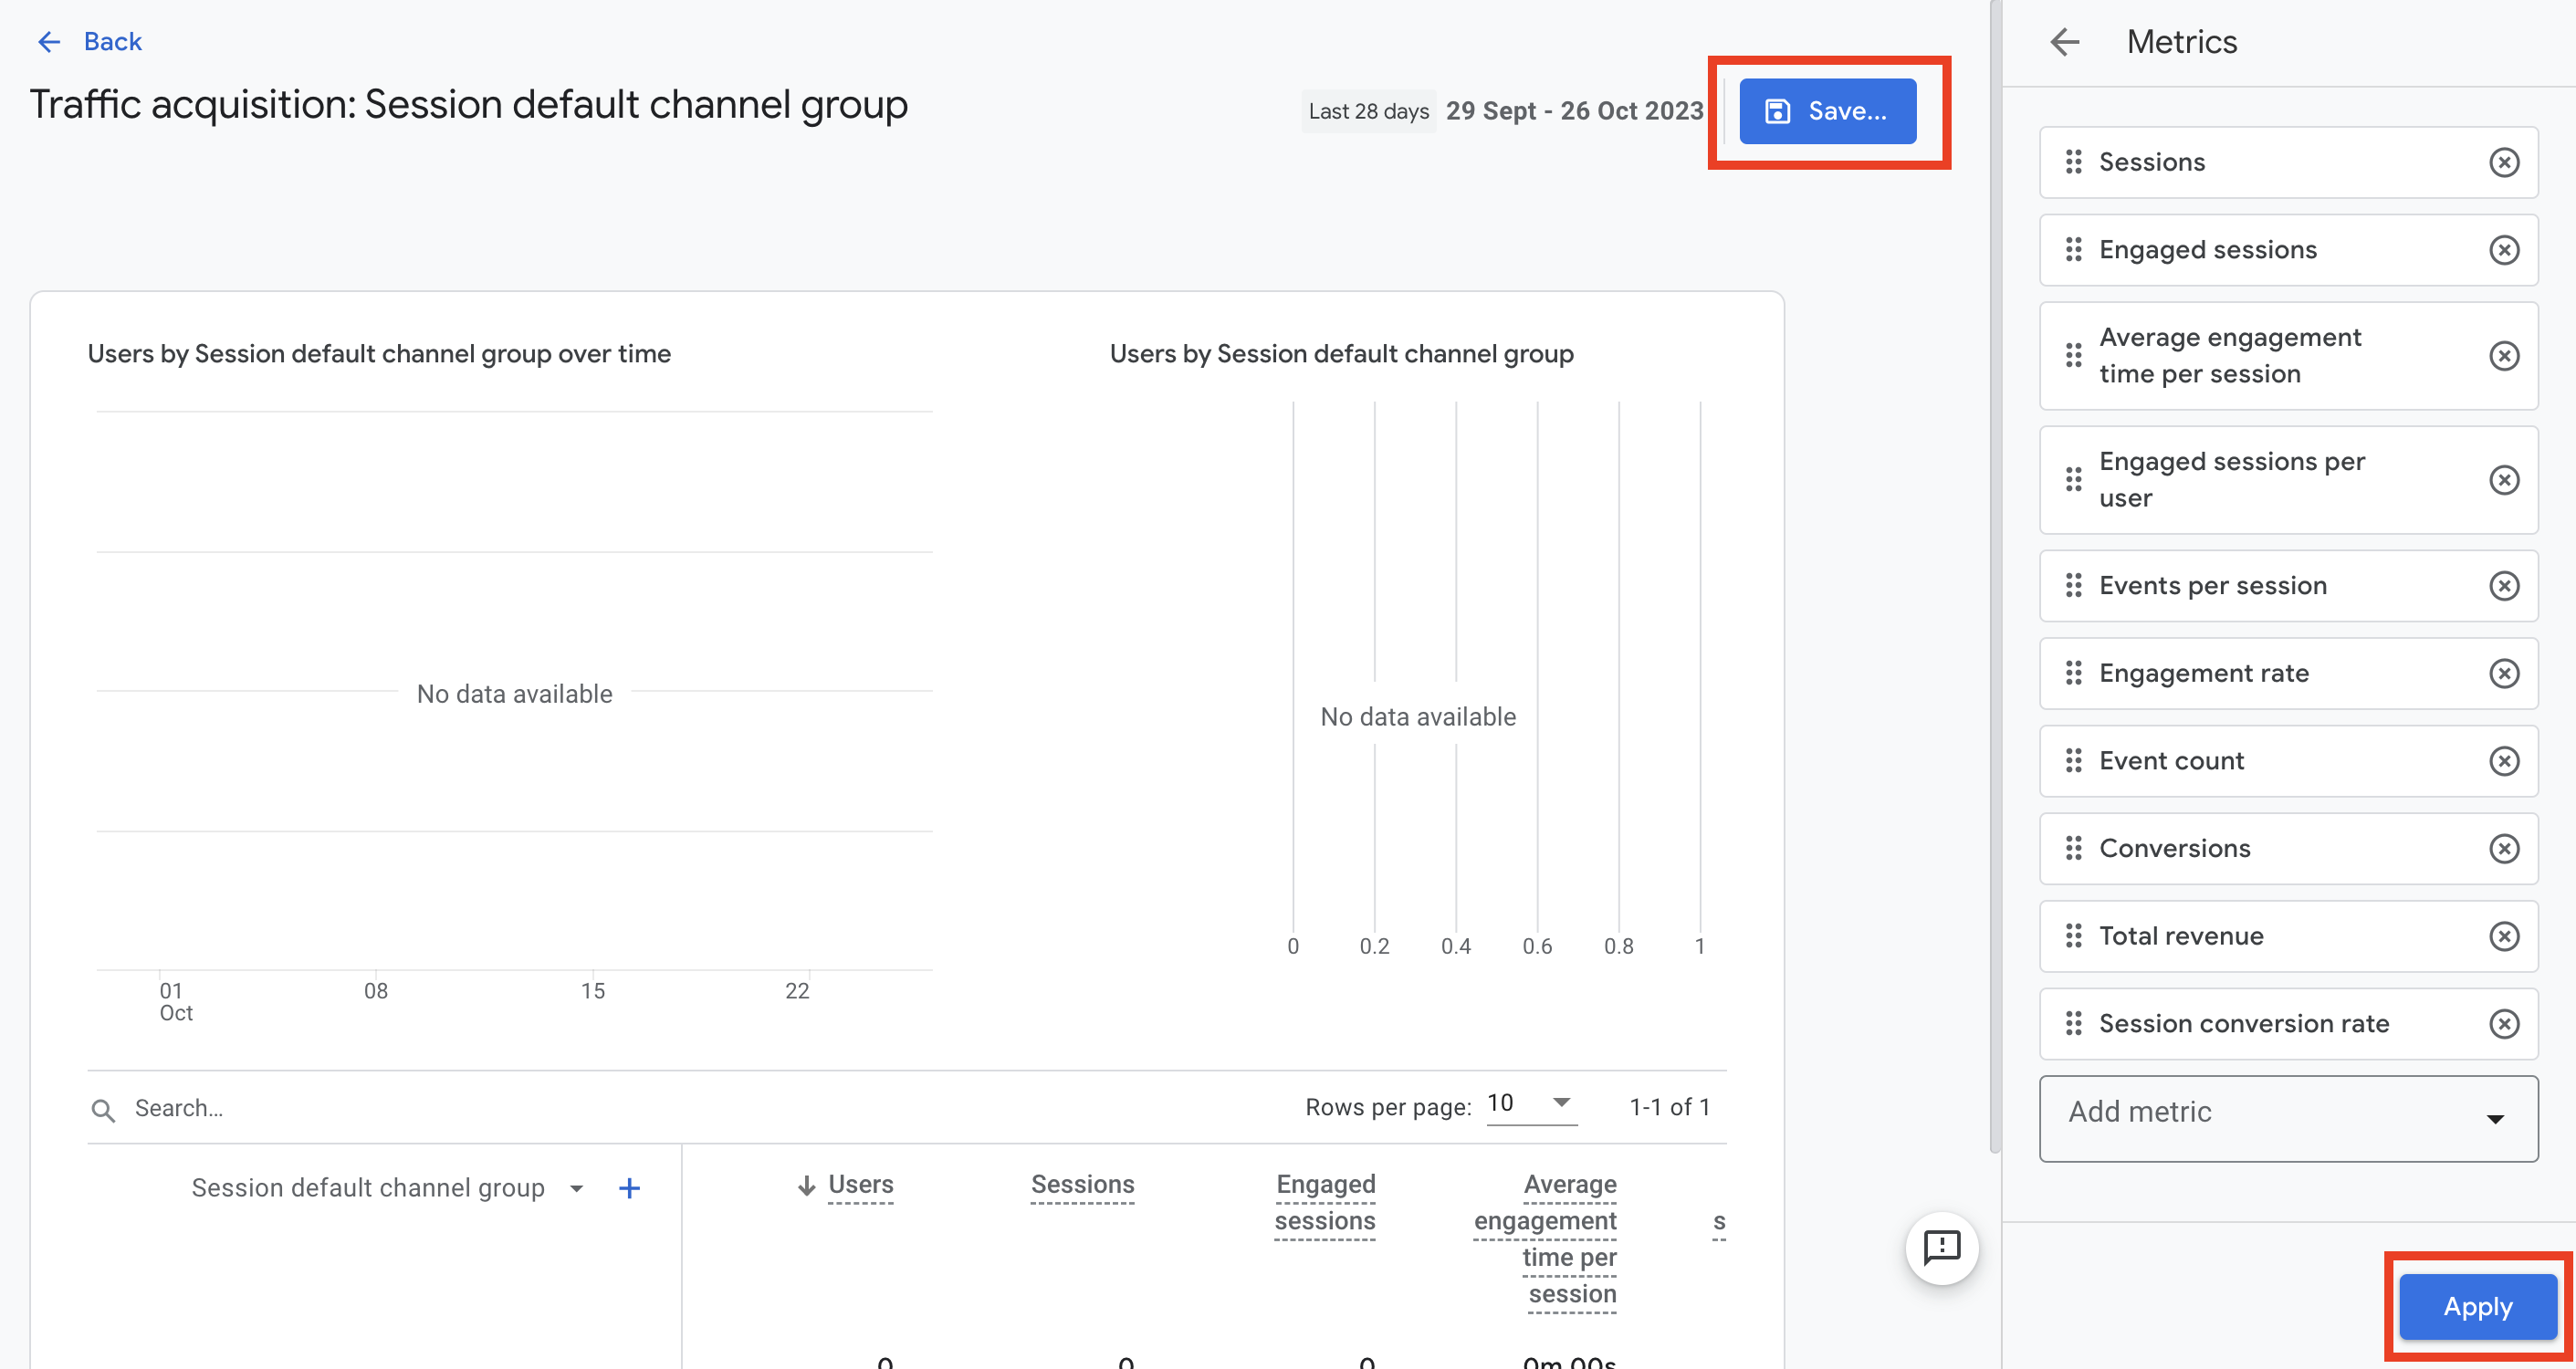
- Look for and choose the Session conversion rate metric.Click on Apply and Save.
You can view the overall conversion rate for your site and segment the data by various dimensions, such as traffic source, device type, and user demographics.
Shopping cart abandonment
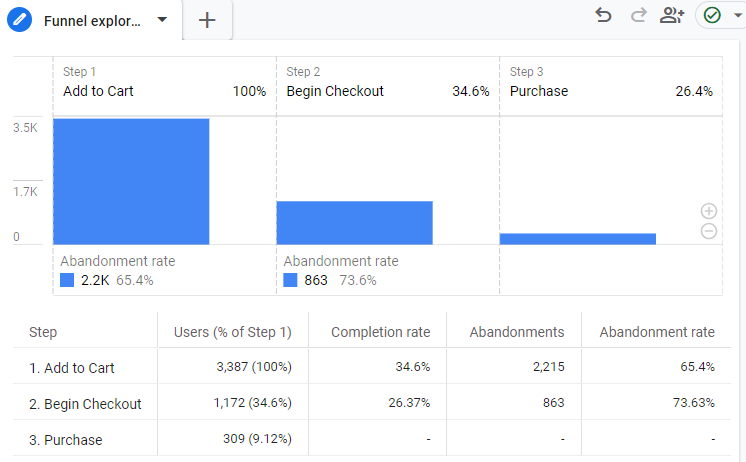
Shopping cart abandonment occurs when potential customers add items to their online shopping cart but leave the website without completing the purchase. This metric is crucial for e-commerce businesses as it indicates lost sales opportunities and can highlight issues in the purchasing process that need to be addressed.
On average, about 70% of shoppers abandon their carts before completing their purchase. This high percentage represents a significant challenge for online retailers, but it also presents an opportunity to improve the customer experience and recover potential sales.
How to track shopping cart abandonment in GA4
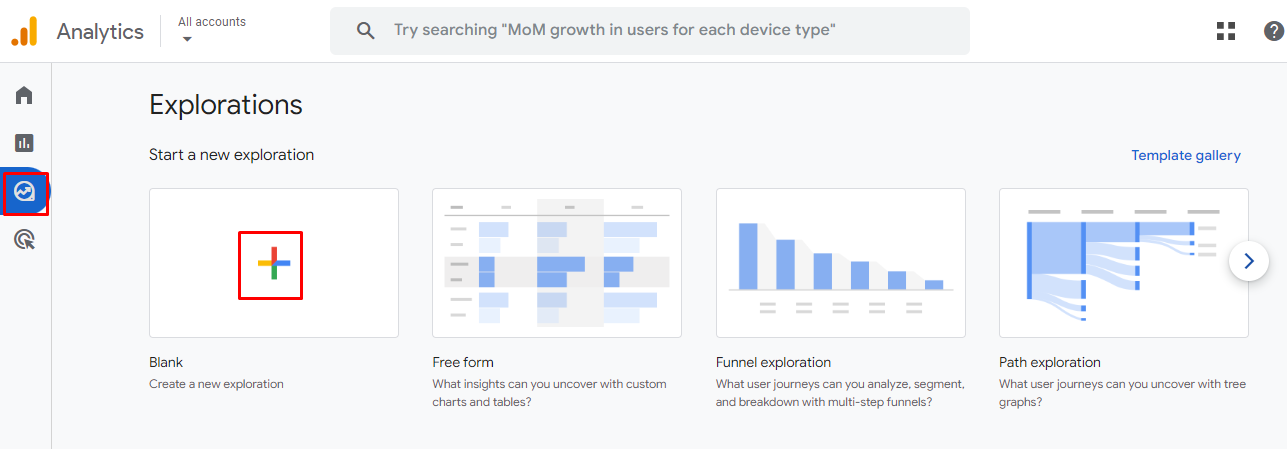
- Navigate to the Explore section in your GA4 property.
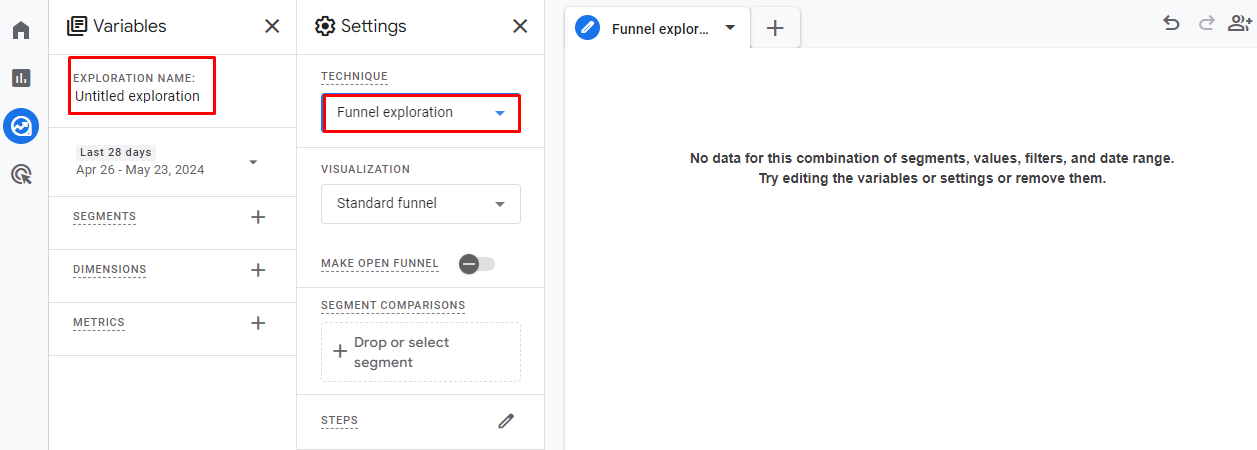
- Create a new Blank Exploration report.
- Name your report, then select the Funnel exploration option in the Technique box.
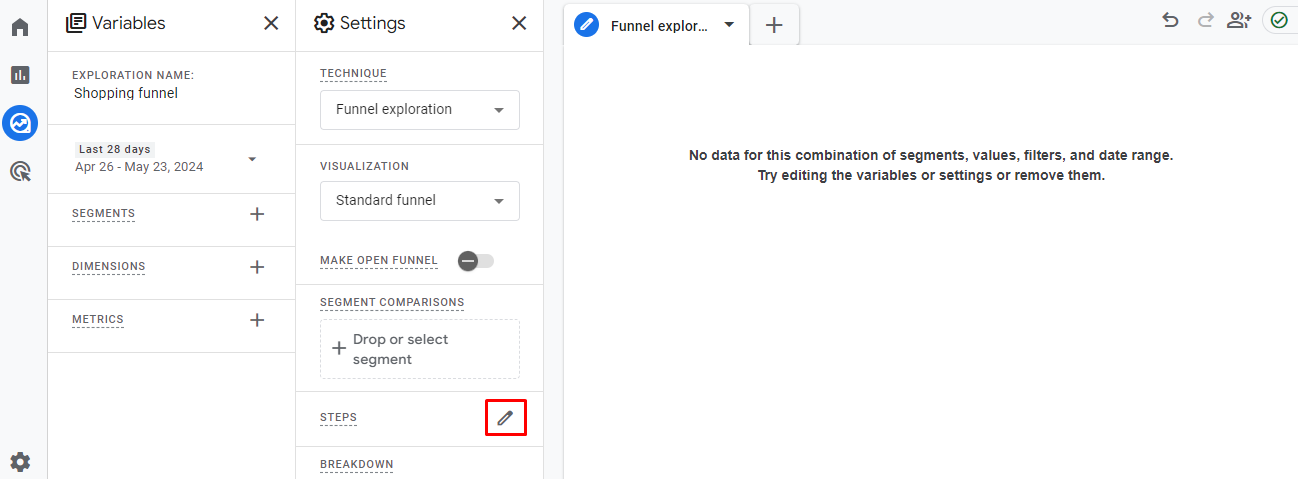
- Click on the Pencil icon by STEPS
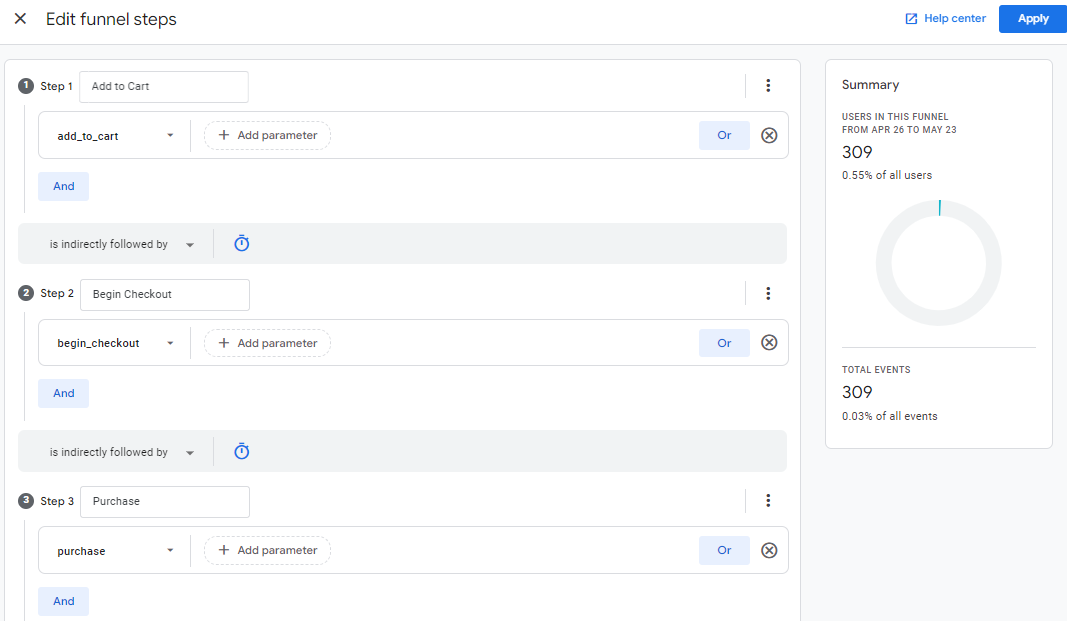
- Create your Funnel Steps: you need to update the name, add new condition dropdown, and Add step button.
- Name Step 1 Add to Cart and select add_to_cart as the condition
- Name Step 2 Begin Checkout and select begin_checkout as the condition.
- Name Step 3 Purchase and select purchase as the condition.
- Click the blue Apply button in the upper right corner of the screen to generate the funnel report.
Customer retention rate
Customer retention is one of the critical e-commerce metrics you should track GA4. You might wonder: Why? It’s because it’s generally more cost-effective to retain existing customers than to acquire new ones. However, many first-time buyers may not return for subsequent purchases unless they are nurtured carefully. Therefore, implementing a strong retention strategy can significantly improve your chances of encouraging these first-time buyers to return and make repeat purchases. And in order to do this, you must keep a close eye on your retention rate.
Accessing customer retention data in GA4
- Open GA4 and go to the Explore section.
- Select the funnel report you previously created for shopping cart abandonment.
- In the funnel report, look for the Dimension section.
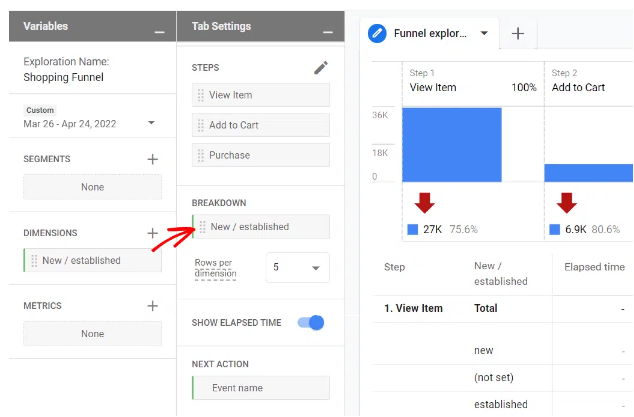
- Add the New/established dimension to your report. This dimension differentiates between new users (first-time visitors) and established users (returning visitors).
- Drag the New/established dimension into the Breakdown box. This will segment your data to show abandonment rates for new and returning users separately.
- Your report will now display data segmented by new and established users.
Customer lifetime value
Customer lifetime value (CLV) represents the total amount that an average customer is expected to spend at your store over the course of their relationship with your business. It is a crucial metric for businesses, providing insight into the long-term value of individual customers and helping to inform marketing and customer retention strategies.
How to access the customer lifetime value report in GA4
GA4 offers a built-in user lifetime report that allows you to analyze CLV data. Here’s how you can access and utilize this report:
- Log in to your Google Analytics 4 account.
- Click on the Explore tab in the left-hand menu.
- Find the User lifetime option.
- Click on User lifetime to open the report.
- The user lifetime report will display a pre-configured view of your customer’s lifetime value data.
Note: The report is initially broken down by the first user medium, which shows the initial source through which users arrived at your site. To explore other dimensions, click and drag different dimensions (e.g., geographic location, device type) into the Rows box, and remove the existing dimension if needed.
Review the data to understand how different segments of your customer base contribute to lifetime value. This analysis can reveal valuable insights into which customer acquisition channels and demographics are most profitable over the long term.
Top conversion sources & paths
Knowing which referral sources drive the most revenue and the pathways your customers take to complete a purchase is crucial for optimizing your strategies. By looking at the Traffic Acquisition and Conversion Paths reports within GA4, you can get detailed insights into this.
Identifying top conversion sources
- In GA4, go to Acquisition in the left-hand menu.
- Select Traffic Acquisition to view data on how users arrive at your site.
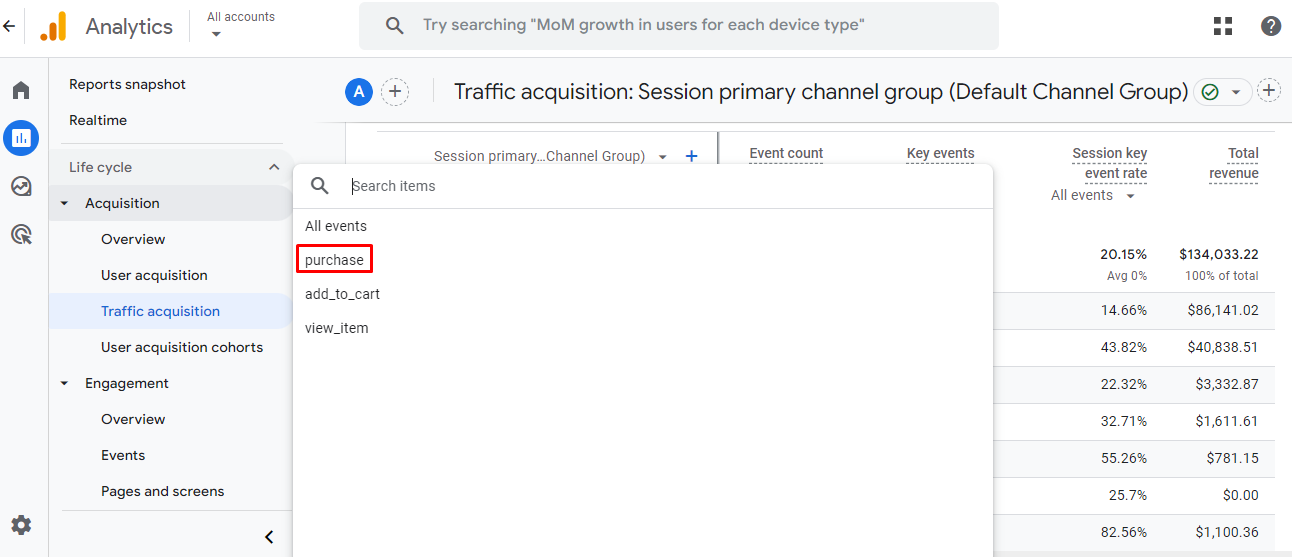
- Scroll to the right in the traffic acquisition table to find the columns for Key events.
- Click the All Events drop-down arrow and select Purchase to filter the data specifically for purchase events.
- The table now displays total purchases and revenue broken down by traffic channel (e.g., Organic Search, Direct, Social, Referral).
Engagement rate
Engagement rate is an e-commerce metric in GA4 that can evaluate the level of user interaction and involvement with your website or app. It measures the percentage of engaged sessions out of the total sessions, providing insights into how effectively your content and features resonate with your audience.
How to access engagement rate in GA4:
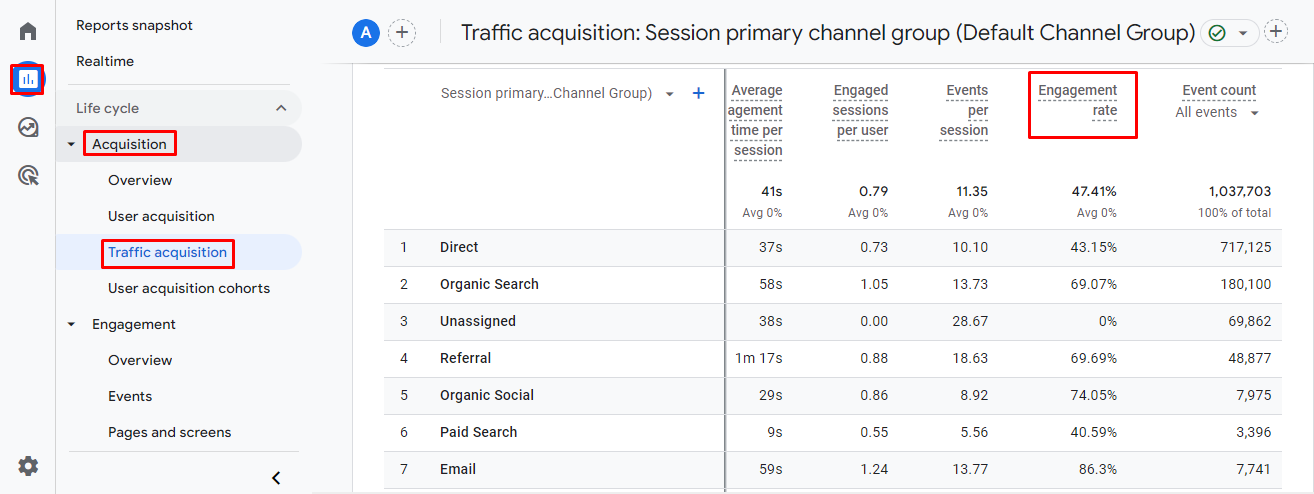
- Go to the Reports tab.
- Navigate to Aquisition -> Traffic aquisition.
- Locate the Engagement Rate metric, which shows the percentage of engaged sessions out of total sessions.
Best practices for e-commerce tracking in GA4
To fully leverage GA4’s features, it’s essential to implement best practices for e-commerce tracking. This ensures accurate data collection and meaningful analysis, helping you make informed decisions to drive growth and profitability.
Track key e-commerce events
Tracking the right events is crucial for understanding user behavior on your site. Standard e-commerce events like view_item, add_to_cart, begin_checkout, and purchase should be implemented to capture essential user interactions. Additionally, consider using custom events to track specific actions relevant to your business, such as coupon usage or wishlist additions, for a more comprehensive analysis.
Utilize enhanced measurement features
GA4’s enhanced measurement settings automatically track interactions like page views, scrolls, outbound clicks, and video engagement. Enabling these settings helps you gather insights into user engagement without additional tagging. Monitoring engagement metrics such as Engaged Sessions and Average Engagement Time can highlight areas where user experience can be improved.
Properly configure GA4 for e-commerce
Setting up GA4 for e-commerce tracking is essential for capturing detailed data on user interactions and sales performance. Start by enabling enhanced e-commerce tracking in GA4 to record key events like product impressions, add-to-cart actions, and purchases. Ensure that your data layer is correctly implemented to pass all relevant product information to GA4, such as IDs, names, categories, prices, and quantities.
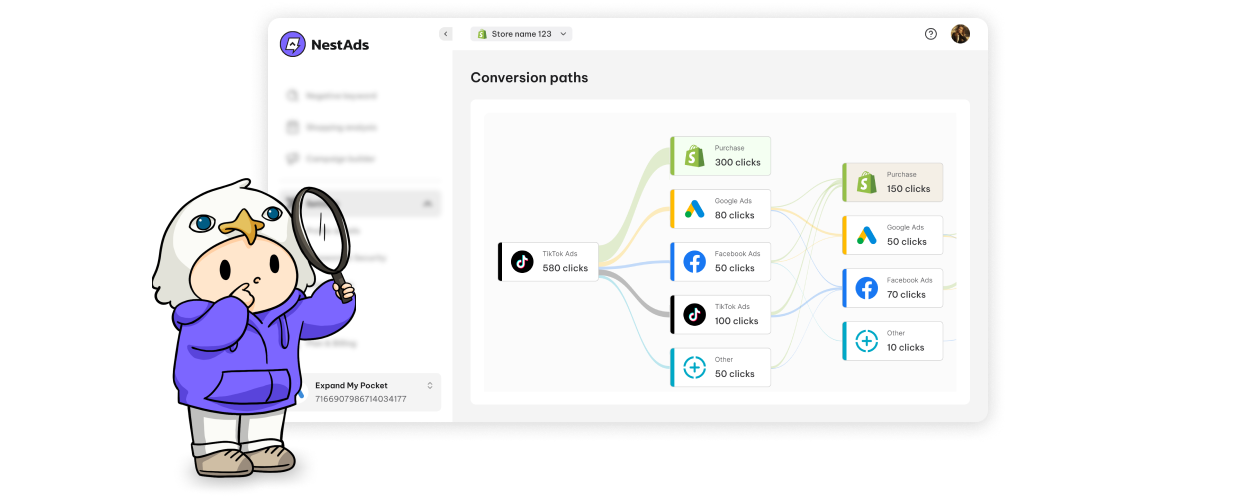
However, if you find setting up GA4 is difficult and complicated, try NestAds – a GA4 alternative solution. Our advanced ad tracking and marketing attribution software seamlessly integrates with platforms like TikTok, Facebook, and Google, providing you with a comprehensive view of your marketing strategies and online sales channels.
With NestAds, you can track key metrics such as ROAS, CPA, and conversion rates across multiple channels, gaining both a holistic view and detailed insights into individual customer journeys. Our customizable attribution models allow you to compare channel performance and identify top sales drivers, while Creative reports help you optimize ad performance with actionable insights into your most effective creative tactics.


