Do you recall your first Facebook ad campaign? Or that initial visit to the Facebook ad manager? I certainly do, and it was a bewildering experience. The abundance of information on a single page left me feeling overwhelmed, with a nagging fear of accidentally deleting my campaign. Fortunately, that didn’t happen, and I eventually became familiar with the platform. Looking back, I wish there had been a helpful guide to maximize this valuable tool. So in this blog post today, we’ll explore the world of Facebook ads report. We’ll cover what they are, why they matter, and how to use them effectively. Let’s get started!
What is a Facebook ads report & where to find it ?
First, let’s get started with the basics. What is a Facebook ads report? A Facebook ads report is a detailed analysis of your ad campaign’s performance on the platform. It provides a set of information, including metrics like impressions, clicks, conversion rates, and costs. Not to mention, these reports can also be customized to focus on a specific time frame, audience segments, or ad objectives. This is why it is an essential tool for marketers to get a comprehensive view of their ad campaign’s effectiveness.
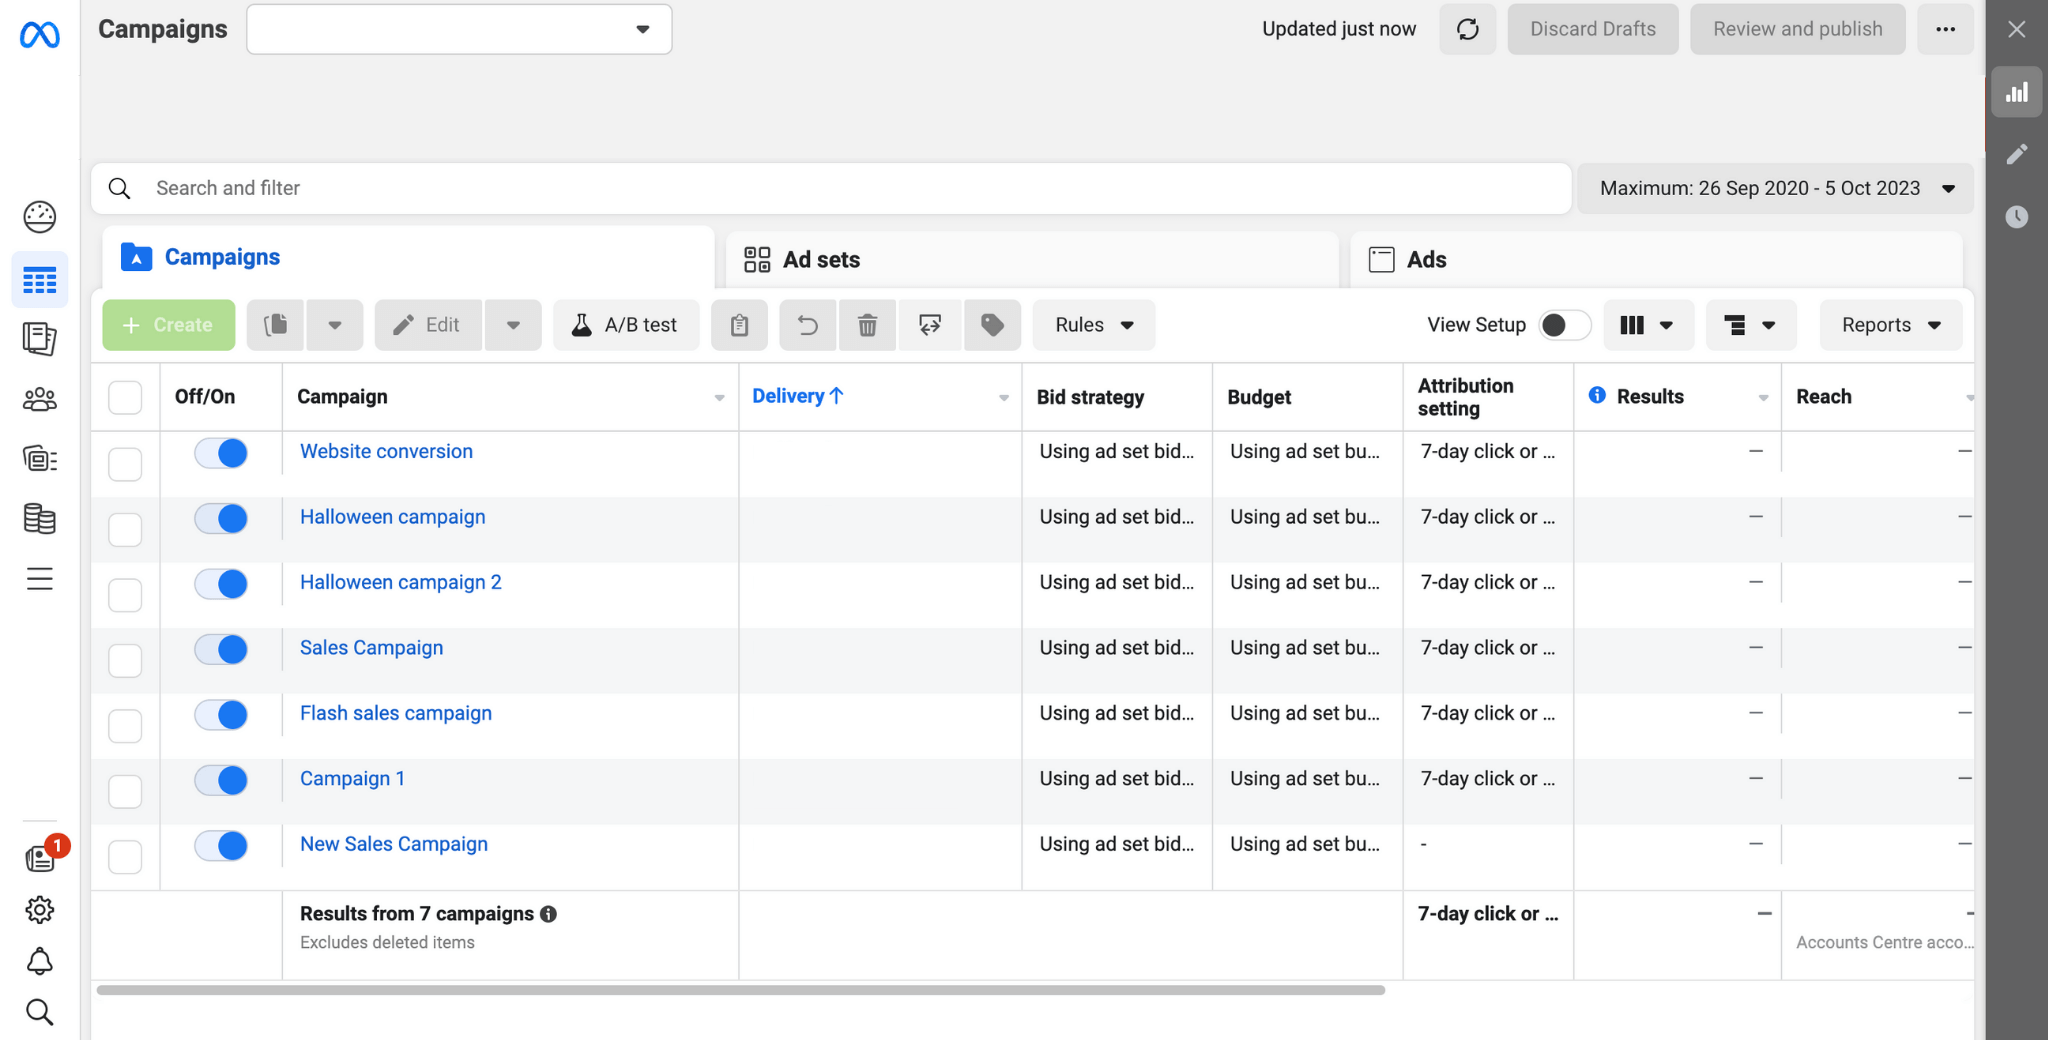
As to where to locate Facebook ads report, you can visit Ads Manager (formerly known as Facebook Ads Manager). This tool can help you monitor and analyze your advertising campaigns with performance data across Facebook, Instagram and Audience Network. Through Ads Manager, businesses can analyze their campaign results, get a peek into the audience segment, discover which channel is driving conversions and so much more. Equipped with these valuable insights, advertisers will be empowered to make better and more informed decisions when it comes to building their Facebook ads campaigns.
The Facebook Ads Manager Display
Some common ad metrics in Facebook Ads
Probably the most important part of any Facebook Ads report is Facebook ad metrics. These are the quantitative units that measure the different aspects of your ad campaigns. Some of the most common Facebook ad metrics are:
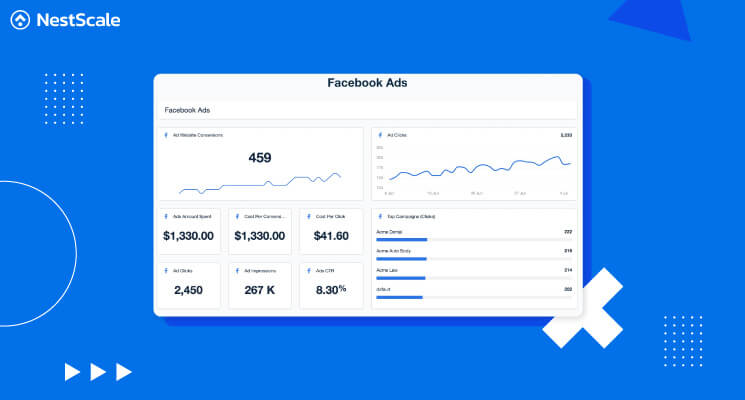
- Impressions: The number of times your ad was displayed to users. In fact, a high number of impressions usually signals a more optimized ad.
- Clicks: The number of times users clicked on your ad. If your ad has a high click result, it most likely means that your ad is effective in attracting customers’ attention.
- Click-Through Rate (CTR): A percentage that indicates the ratio of clicks to impressions, providing insights into ad engagement.
- Cost per click (CPC): The amount you have to pay for every click from your ad campaign. A high CPC might result in a decrease in the overall return on investment (ROI). So if your CPC is high, you should revisit your ad content, creatives, and additional settings to see if they are fully optimized.
- Conversions: The desired actions taken by users after clicking on your ad. As of now, the conversion objectives offered by Facebook are engagement, leads, and sales. Some of these conversion events include customers making a purchase, adding products to their cart, or signing up for a newsletter.
- Ad Spend: One of the most obvious metrics, but it definitely cannot be overlooked. This is the total amount of money spent on your advertising campaigns.
In essence, a Facebook Ads Report is a comprehensive breakdown of your advertising efforts on the platform, providing you with the insights needed to optimize your campaigns. They can also help you allocate budgets wisely and make data-driven decisions to achieve your marketing objectives. It’s a fundamental tool for any business or advertiser looking to harness the full potential of Facebook advertising.
How to get Facebook ads report?
Now that we’ve covered what Facebook ads report is and their many benefits, it’s time to get to action. Before we get down to tracking or analyzing, a mandatory step is to generate your Facebook ads report from Ads Manager. Here, we are going to provide you with a step-by-step guide on how to get a Facebook ads report.
Step 1: Go to your Facebook Ads Manager page
There are actually several ways to go about this. The guide below will include 3 of the most popular methods to access Facebook Ads Manager.
- Option 1: Access Ads Manager by using the direct link. Remember to bookmark this link for easier access next time.
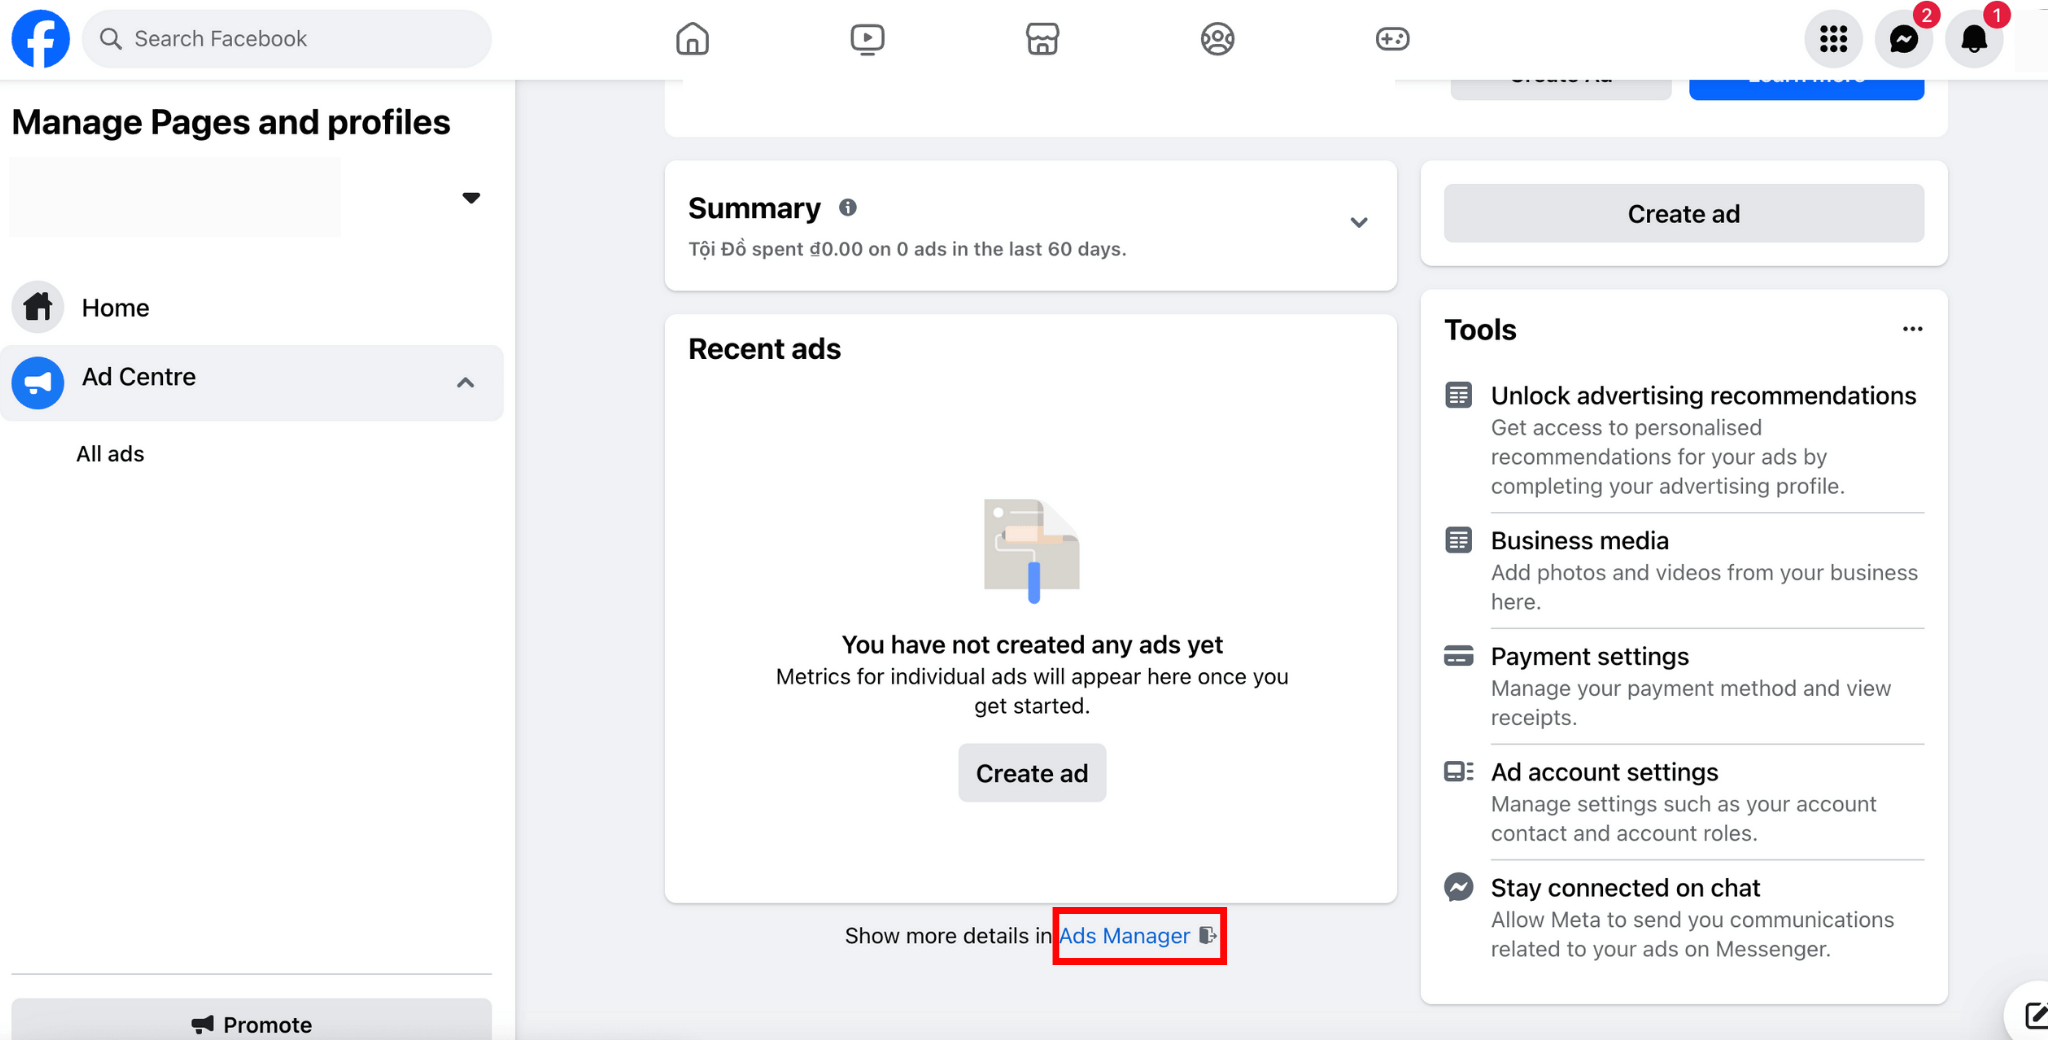
- Option 2: Access Ads Manager from your business page. All you have to do is go to the menu bar on the left-hand side. You’ll then see a dropdown option under Ad Center. Click on All Ads and you’ll be redirected to the All Ads page. Scroll to the bottom of that page and you should see an option to go to Ads Manager.
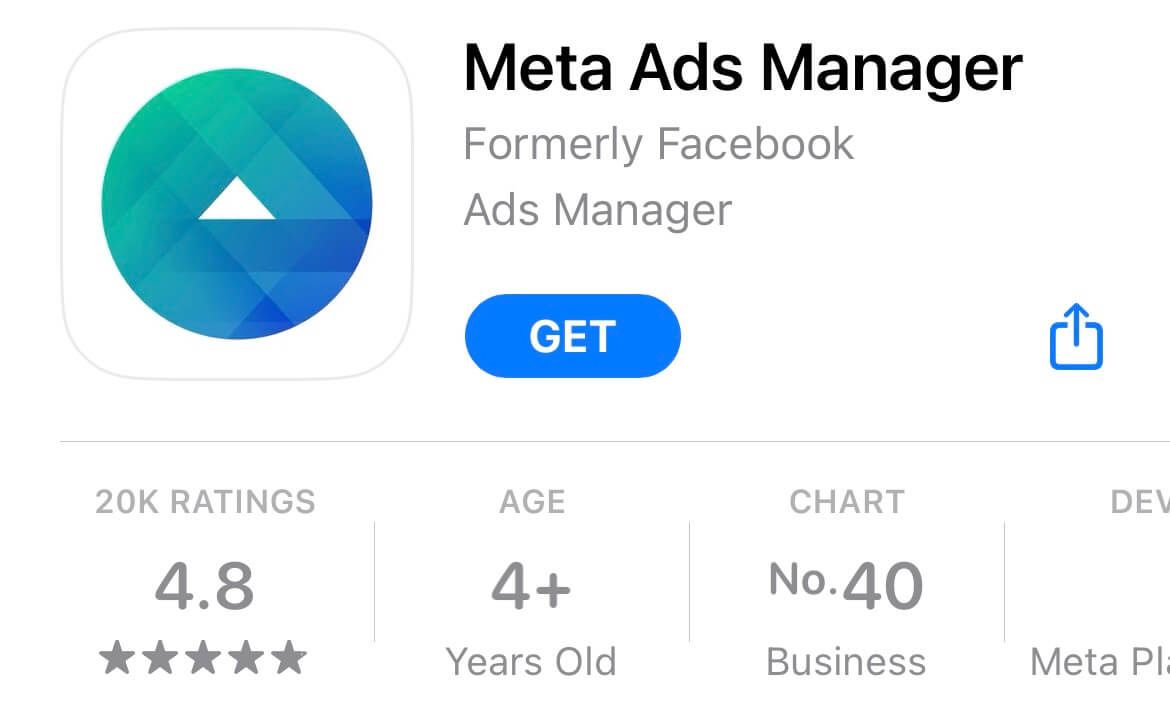
- Option 3: Access Ads Manager by using the mobile app Meta Ads Manager.
Step 2: Locate your ads reports
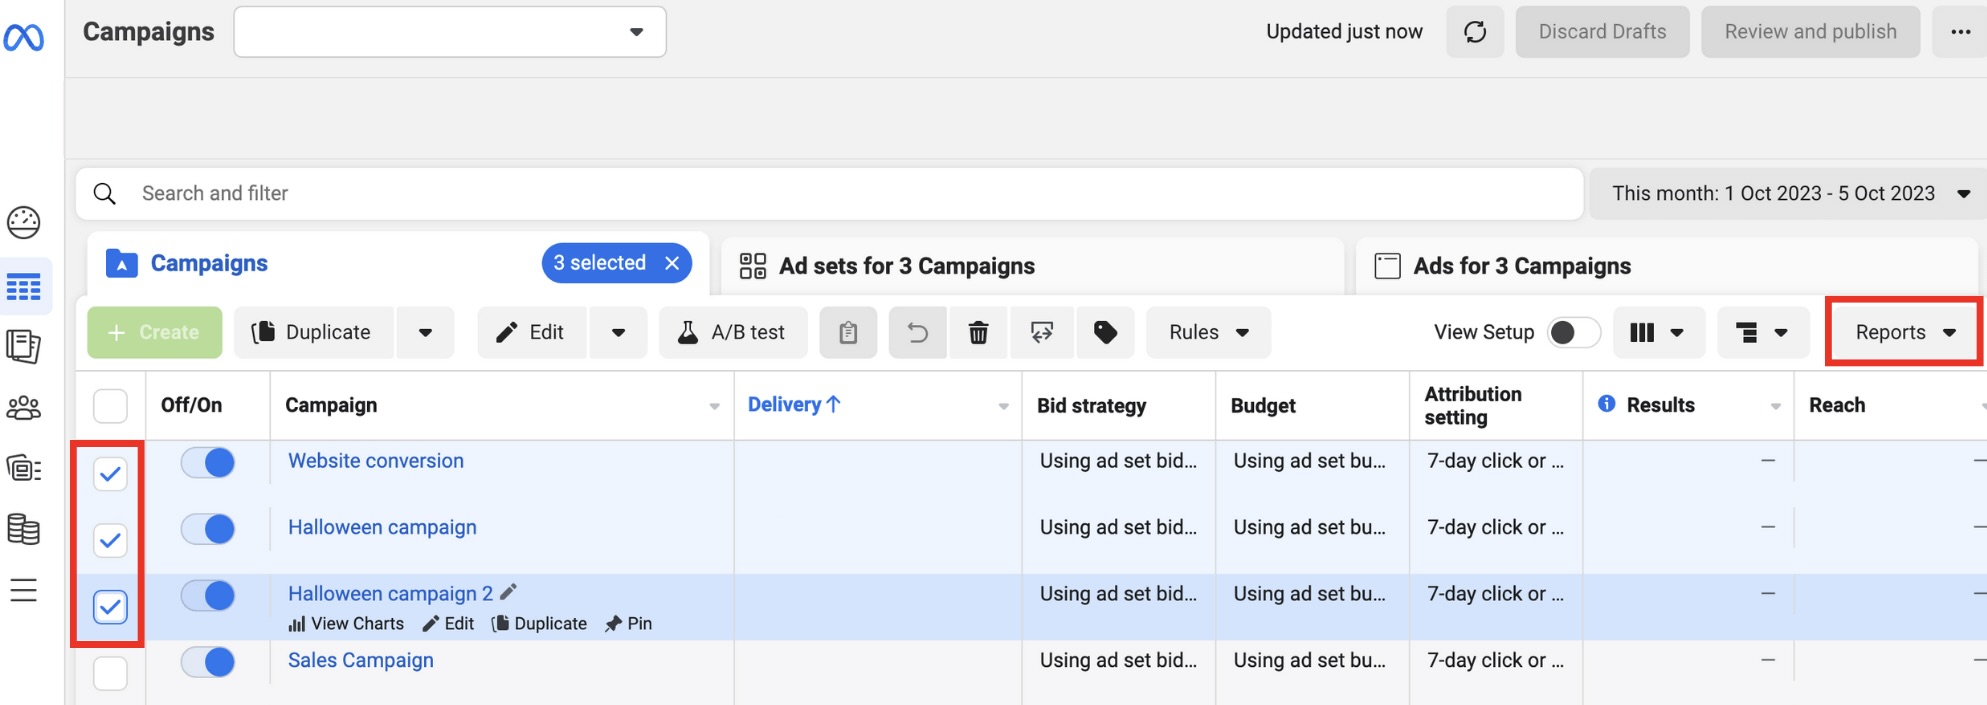
- Click on the Campaigns tab in the Ad Manager menu on the left side of the page.
- Once there, select the ad campaigns you want by ticking the boxes on the left side of the page. Then, move to the right-hand side of the page where you can see the Reports button on the action bar.
Step 3: Create your ads report
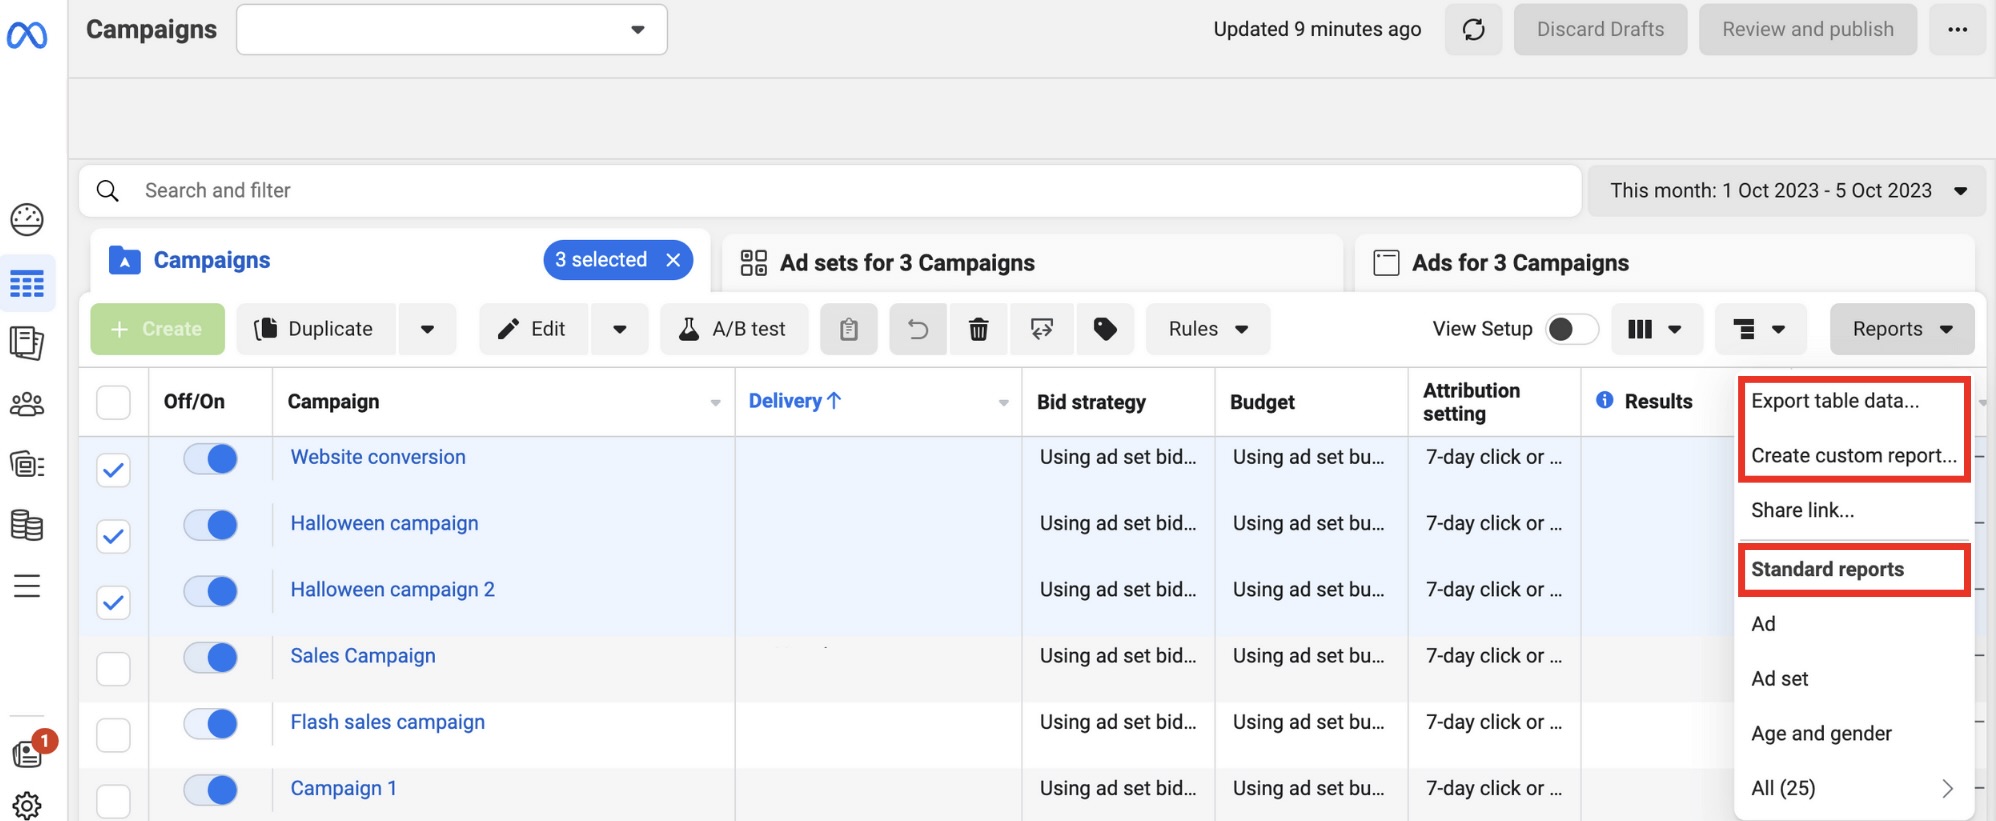
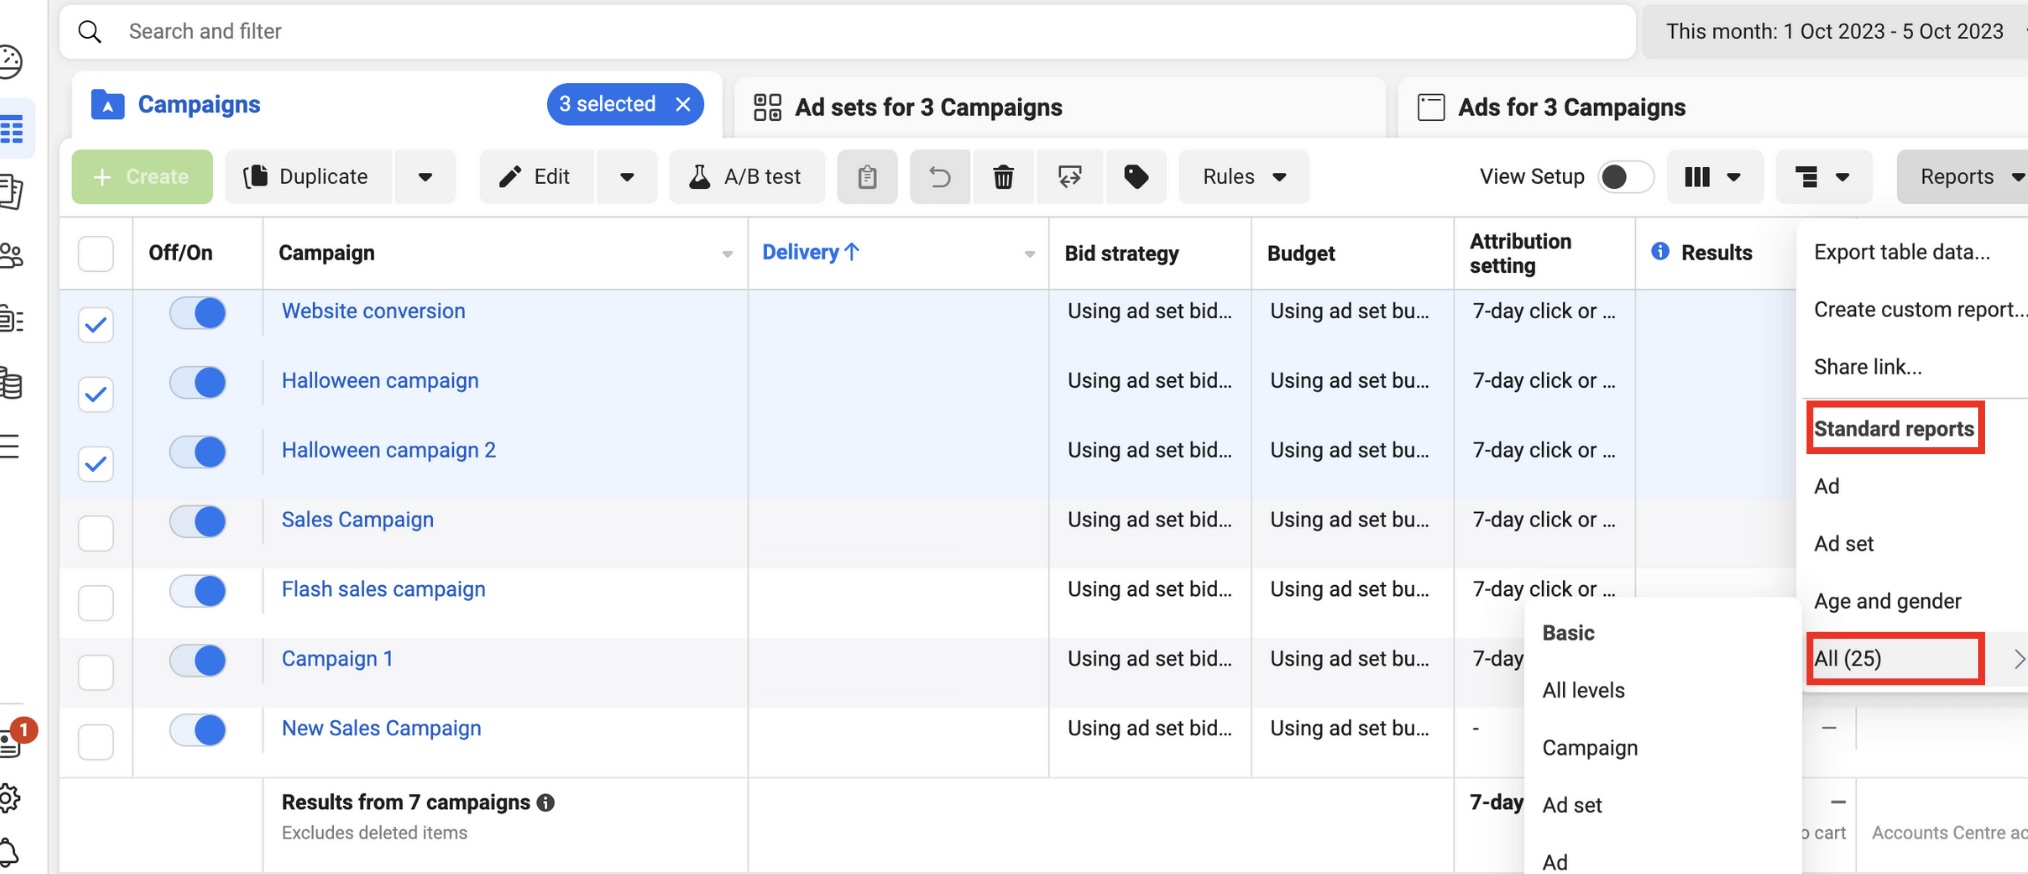
There are actually 2 ways to create an ads report. You can either choose to Create custom report or choose from the 25 Facebook ads report template under Standard reports.
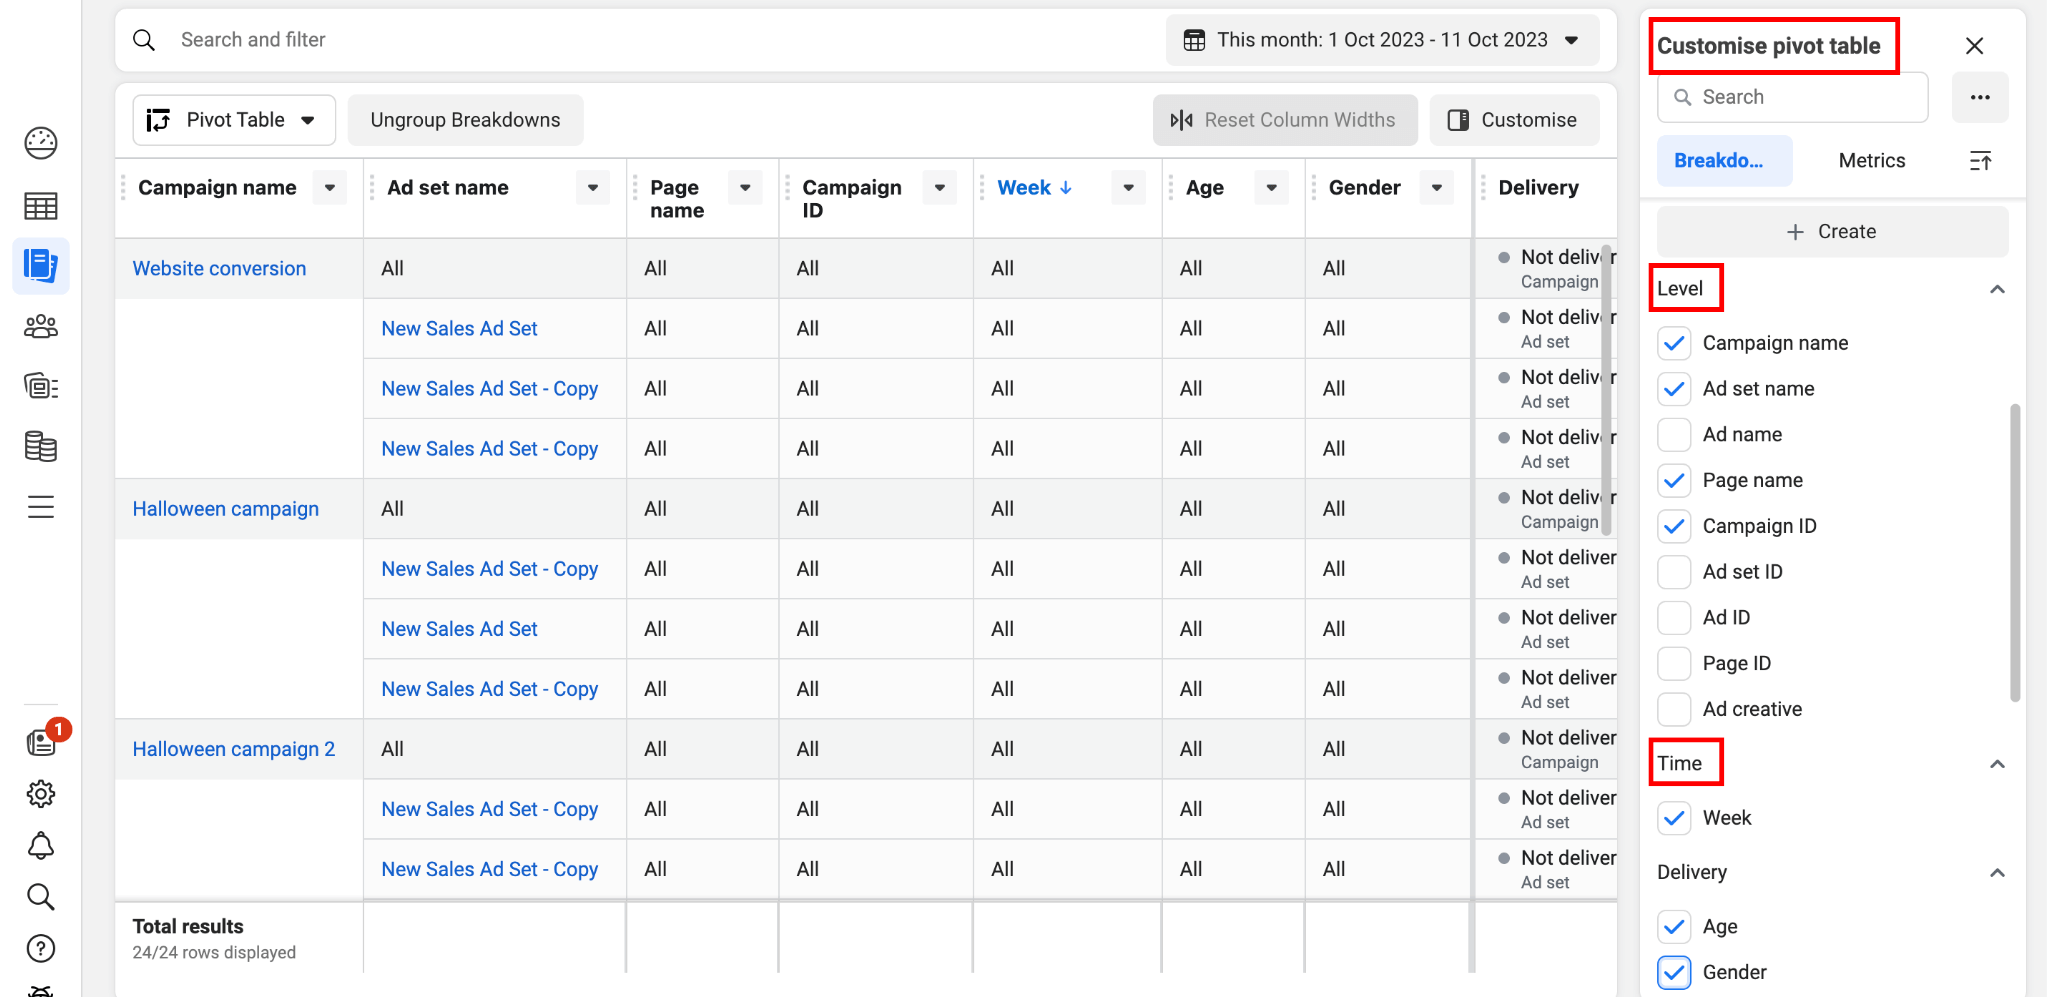
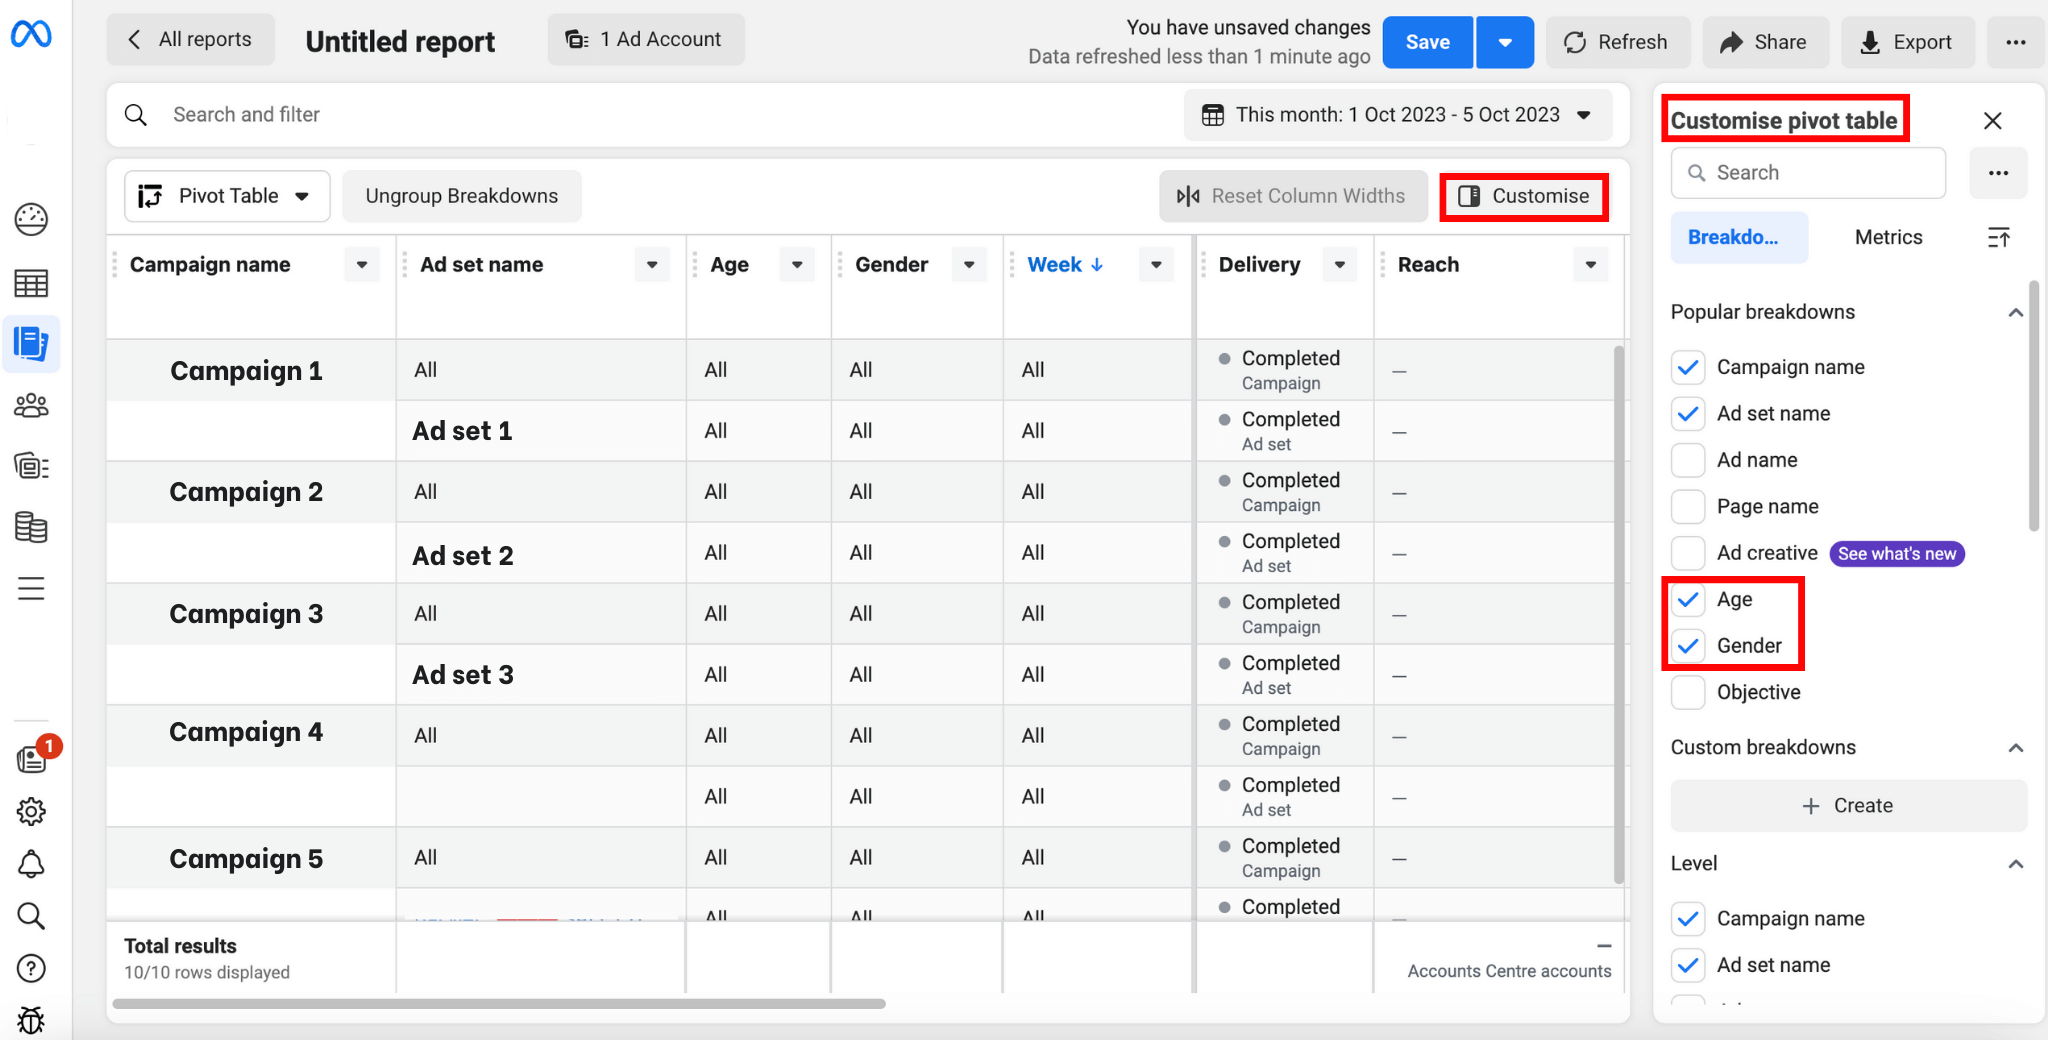
- Option 1: If you choose Create custom report, you’ll be redirected to the Ad reporting page. Here, you can adjust the reports attributes or ads metrics. All you have to do is click the Customize button on the menu bar. Then a Customize pivot table menu will pop up on the right-hand side. Now, tick your desired metrics, data range, actions, etc. and you’re done.
- Option 2: If you choose Standard reports, there are 25 templates available. Here you can find some of the most popular breakdowns based on demographics, delivery, actions and more. After picking a template, you can still customize it further to better fit your preference.
Step 4: Export your ads report
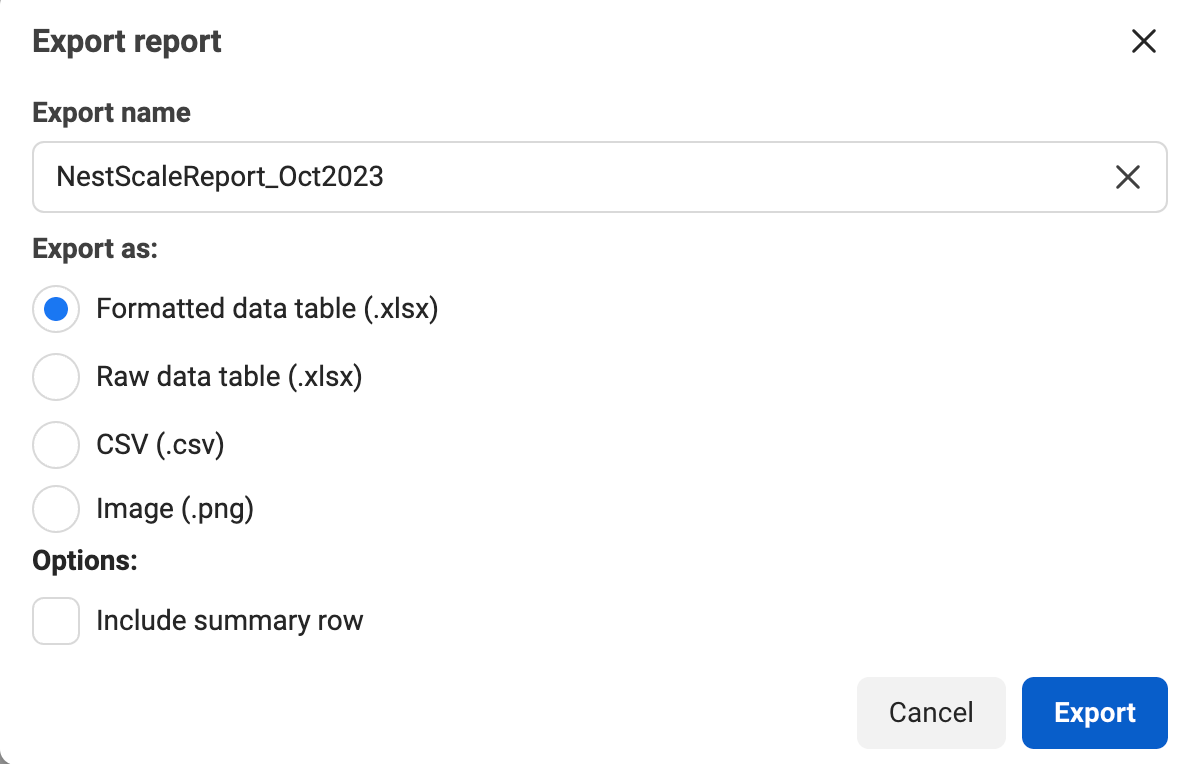
- Once you’ve finished customizing your report, remember to name your report. Then, hit Save and Export.

- Here, you can choose the format of your report. The available formats are formatted/ raw data table (xlsx), csv or image (png). You can also choose whether to include summary row or not.
Once you have your data set, you can choose to manually import them to Google Sheets then analyze them in Data Studio – a web-based data analysis and visualization tool offered by Google. Some might refer to this method as Facebook ads data studio. This option will allow you to custom-build your reports, but it will take quite long as the process is manual.
By following these steps, you can generate Facebook ads reports tailored to your campaign’s goals and objectives. And, regardless of your chosen tool, it’s important to remember to update your data regularly and monitor your campaigns closely to get the best possible results.
How to read Facebook ads report?
Now that you have successfully exported your Facebook ads reports, it’s time to get down to business and read your Facebook ads report. This is essentially the most important part of any business’s Facebook advertising strategy, as it will determine the next step of the marketing plan. So, in the next part of our blog post, we’ll provide you with a step-by-step guide on how to read and analyze a Facebook Ads Report effectively.
Focus on ad campaign goals
The first thing you need to do is to set out some goals for your ads campaigns. This is one of the most important parts of any performance evaluation, as it will determine whether your ads are effective or not.
Once you have your goals, you’ll also be able to identify the campaign objective, as well as the most important metrics to keep an eye on in order to deliver those goals. Some questions to ask when defining your campaign goals are: What is the reason for this ad campaign? What type of conversion event are you looking for? What are you hoping to achieve through this activity? These are the essential questions you need to answer to pinpoint exactly which ad metrics would be relevant for your campaign.
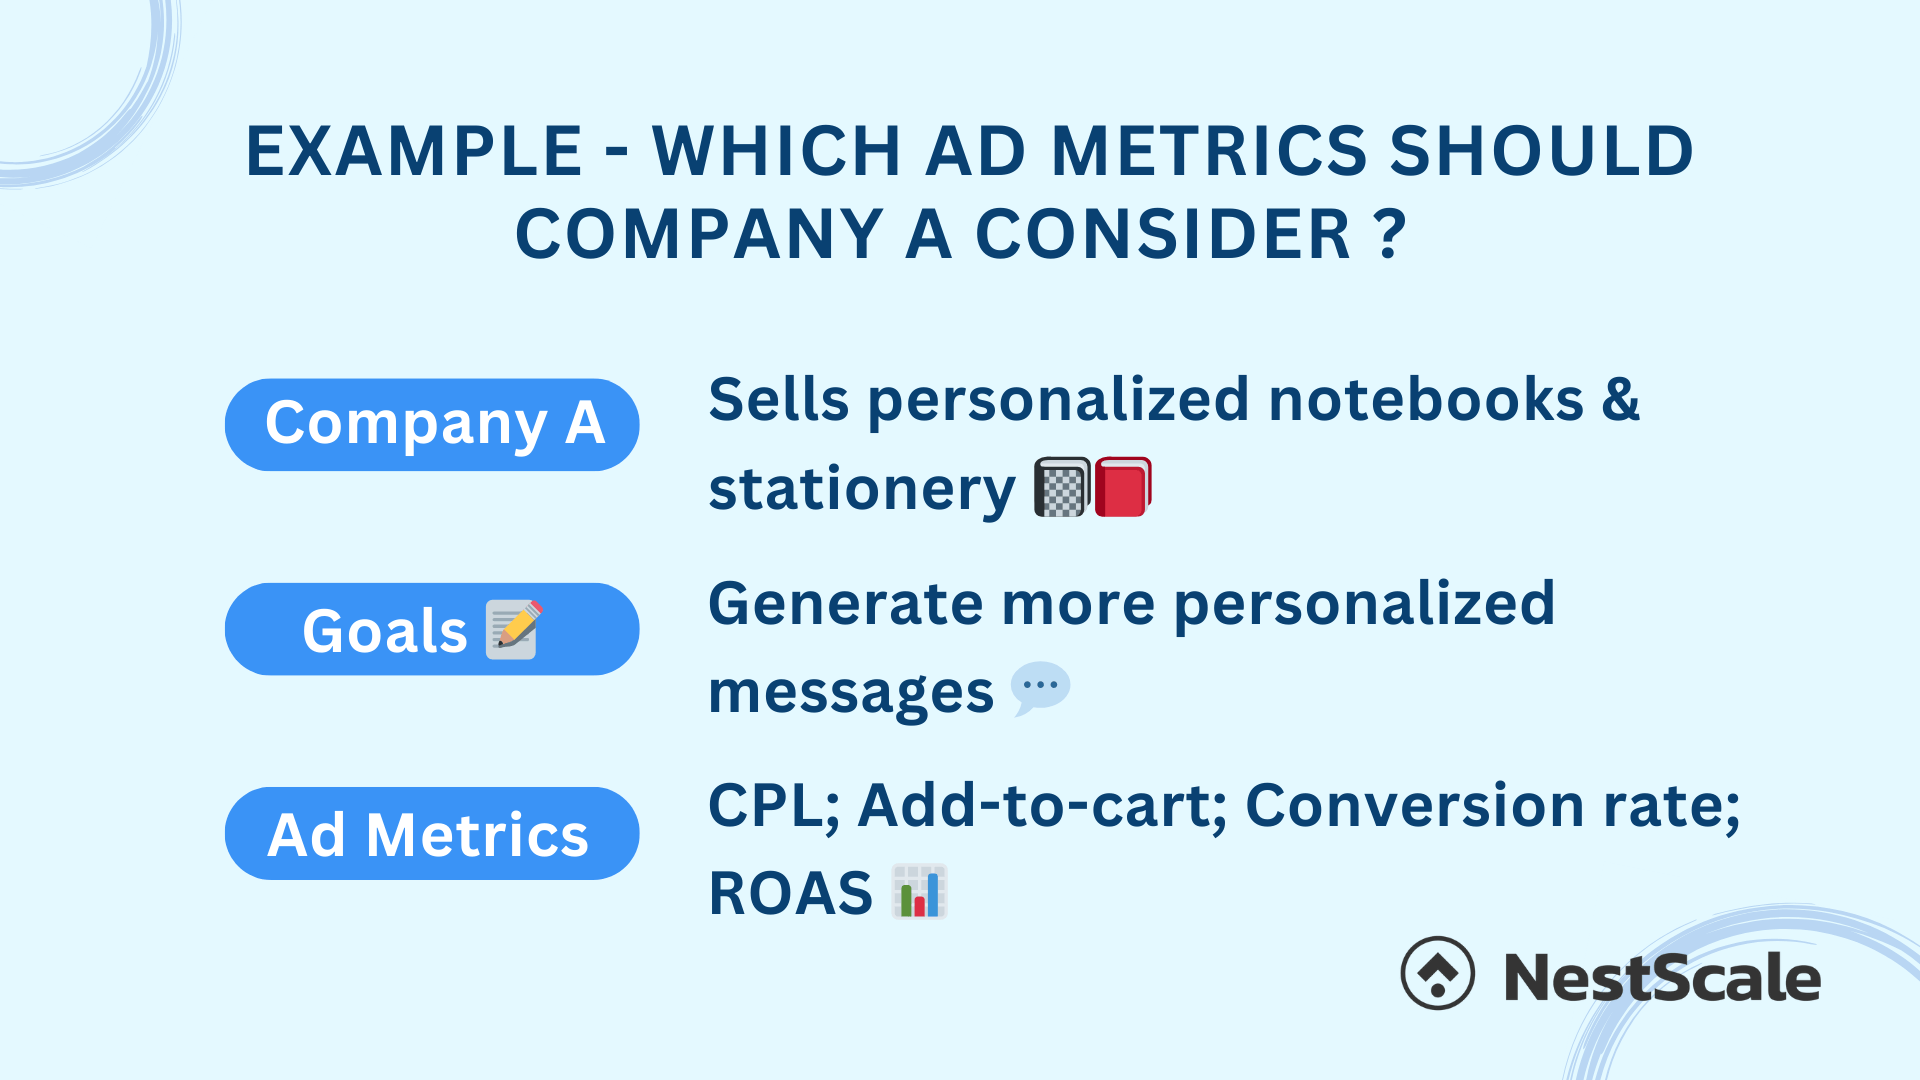
Let’s look at an example for more reference. Company A sells personalized notebooks and stationery. Their goals for this month’s ad ad campaign is to generate more personalized messages. In this case, some ad metrics that company A should consider are:
- CPL (cost per lead/ message)
- Add-to-cart
- Conversion rate
- ROAS (return on ad spend)
We can see company A’s main objective for this month’s ad campaign is getting more personalized messages. So naturally, CPL is the first metric we should consider. This number will show how much company A has to pay for each personalized message. Besides, we should also consider other metrics, such as conversion rate, to see if those messages actually turn into a purchase. When reading company A’s ads report, they should rely on these metrics to evaluate the effectiveness of their ad campaign.
Analyze your ad data one level at a time
In Ads Manager, there are various levels from which you can monitor your ads performance. From account level to get an overview of your ad account performance, to each campaign, ad set and lastly each ad variation to determine which ones are the most effective. Here, you’ll be able to spot performance trends or patterns over time to make more informed decisions.
Step 1: Read results from ad account level
At this account level, you’ll be able to get an overall picture of all your campaigns’ results. You can also adjust the time period so observe your ad account performance over a particular period of time. Here, Facebook will also provide you with a summary of all your advertising activities on the platform. This is particularly useful if you want an overview of all your Facebook advertising efforts without diving too deep into the details of each campaign. You can access this page simply by going to the Ads Manager page. Once there, navigate to the left-hand side menu bar and select Account Overview.

Step 2: Read results from ad campaign, ad set or ad variation level
Once you’ve got an overview of your entire ad account performance, it’s time to zoom in a little closer at the results of each campaign, as well as the many ad sets and ad variations within it.

- At the ad campaign level: you’ll gain a bird’s-eye view of your overall performance, with metrics like reach, impressions, and click-through rates giving you a sense of your campaign’s effectiveness. Here, pay attention to the correlation between your campaign objective and the metrics you’re monitoring. Your results will only make sense if the ad metrics are relevant to the campaign objective.
- At the ad set level: Here, you can adjust your budget for each ad set and set your target audience. You’ll also be able to determine which ad set and audience segment are the most effective.
- At the ad level: Here, you get in-depth insights into individual creatives, headlines, and ad copies, allowing you to identify top-performing elements and fine-tune your content strategy. You could also see which ads yield high results and determine which type of content or creatives the audience prefers for future campaigns.
Break down your ads by delivery, action and time
Another method to analyze your ad results is to utilize the Breakdowns feature in Ad Reporting. There are several breakdown options for you to choose from, including: by level, delivery, time, action, settings and dynamic creative asset. Here, you can gain deep insights into each aspect of your ad campaigns. Here’s how you can access this breakdown feature:
- Access Ad Reporting page and click on Customize. Then, you’ll see the Customise pivot table menu pop up on the right side of the page.
- A Customise pivot table menu will pop up on the right side of the page. Scroll down the menu to choose the Breakdowns options. Here, you can categorize your report by time, action, etc. Based on this information, you’ll be able to better tailor your audience targeting and allocate proper resources to high-performing ad sets.
Make the most of your Facebook Ads Report
We’ve just taken you through the ins and outs of Facebook ads reports, from understanding what they are to mastering the art of reading them. However, that’s not all a Facebook ads report is about. The most important task isn’t to export your report, or read it from front to back. What truly matters is how to turn those raw data into actionable insights that can eventually translate into real-world impact.
But how do we accomplish this? To turn data into impactful actions, we need accurate insights and a vigilant eye on performance trends. Unfortunately, increasingly tightened privacy policies have hit third-party data-reliant advertising platforms hard, including Facebook Ads. This, coupled with Facebook Ads’ shortened attribution window, has created significant hurdles for marketers on the platform.
But there’s no need to panic, as this is where NestAds shines. Our unique NestAds pixel, fueled by first-party data, ensures precise and privacy-compliant insights. What’s more, NestAds offers a flexible attribution window, spanning from 7 to 90 days. This lets businesses delve further into the past to track performance trends over time. Plus, all your raw performance data from various channels finds a home in a single, user-friendly dashboard, streamlining your data analysis. Say goodbye to tab-switching hassles! The time has come to unlock the full potential of Facebook ads reports, and there’s no better partner for the journey than NestAds.


