

As an e-commerce merchant running your store on Shopify or any other platform, you know that data is key to growing your business. But with so many metrics available, it can be overwhelming to figure out which ones truly matter. In this blog, we’ll give you a clear overview of e-commerce metrics and KPIs, focusing on 15 essential ones you need to track for success. We’ll also share practical advice on how to monitor these metrics effectively. Whether you’re looking to boost sales, improve customer engagement, or enhance retention, this guide will help you make data-driven decisions to achieve your goals.
Understand metrics & KPIs for e-commerce
Knowing exactly which metrics and KPIs e-commerce merchants should track is crucial for making informed decisions. And to choose the right metrics, it’s important to understand the general concepts of e-commerce metrics and KPIs, what they cover, and when to use them.
In this section, we will guide you through the differences between e-commerce metrics and KPIs. Moreover, we’ll also discuss key factors to consider when selecting the core metrics for tracking.
E-commerce metrics & KPIs – are they the same?
Before we get into the specifics, let’s clarify an important point: eCommerce metrics and KPIs are often used interchangeably, but they aren’t exactly the same.
- Metrics are quantifiable measures used to track and assess the status of a specific business process.
- KPIs are a subset of metrics that are deemed as the most important indicators of progress toward a specific business objective.
In simpler terms, while all KPIs are metrics, not all metrics qualify as KPIs. The distinction lies in the strategic importance of KPIs, which are directly tied to your business goals.
| Aspect | E-commerce metrics | KPIs |
| Purpose |
– Provide a detailed view of your businesses’ performance across different areas – Track and monitor the effectiveness of various business activities – Identify trends, patterns, and anomalies in business operations |
– Measure progress toward specific business goals and objectives – Focus on critical areas that drive business success – Provide actionable insights that guide strategic decision-making – Align team efforts toward common business targets |
| Scope | – Broad and comprehensive, covering a wide range of business activities | – Narrower in focus, highlighting the most impactful areas of performance |
| Application | – Use to monitor ongoing business activities and operations | – use to set performance targets and measure progress toward achieving strategic goals |
How to determine the metrics & KPIs that matter to your business?
In the fast-paced world of eCommerce, understanding the metrics and KPIs that drive your business can mean the difference between merely surviving and truly thriving. With countless data points at your disposal, zeroing in on what matters most can be daunting. This comprehensive guide will demystify the key metrics and KPIs that are essential for your eCommerce success, offering actionable insights to help you track performance, make informed decisions, and ultimately, drive growth. Dive in to transform your data into a powerful tool for strategic advancement.
Top 15 metrics & KPIs to track for e-commerce businesses
After understanding the general view of e-commerce metrics, let’s explore 15 key metrics and KPIs that are crucial for tracking. To make it easier for you to follow, we’ve categorized them into four main areas: acquisition, engagement, conversion, and retention.
Acquisition metrics
Acquisition metrics are the first step in understanding how potential customers find your eCommerce store. Let’s dive into the key metrics you should track.
Website Traffic
Website traffic counts every visitor to your site, capturing all the ways they might find you—through search engines, social media, direct visits, email campaigns, or referral links. More traffic translates to more potential customers. Tracking this traffic lets you measure your marketing effectiveness and identify trends, helping you fine-tune your strategies for better outcomes.
It’s also crucial to consider not just the amount of traffic but where it’s coming from. Identifying your most effective traffic source is key. By understanding which channels bring the best results, you can invest more wisely, boosting your traffic and optimizing your store’s performance.
Impressions
Impressions measure how often your content or ads are seen, and whether or not they are clicked. This happens across various channels like paid ads, search results, and social platforms.
High impression counts signal broad visibility, essential for brand awareness, though they don’t ensure engagement or sales. Yet, the more impressions you gather, the greater the likelihood that potential customers will see your products and consider a purchase.
Tracking impressions is crucial; it shows the reach of your content within your audience and helps evaluate how effective your distribution strategies are. This insight allows you to refine your efforts and enhance brand exposure.
Reach
Reach measures the number of unique users who see your content or ads. It’s a clear metric that shows how many people are exposed to your message. Unlike impressions, which may count multiple views from the same person, reach tracks each individual, providing a precise indication of your audience size.
High reach is crucial because it means more people know about your brand, helping to build recognition and recall. It reveals how effectively you’re engaging your target market by showing the number of unique users who see your content. Additionally, high reach suggests your marketing efforts are effectively spreading your message, making it an essential metric for evaluating campaign performance.
CPA
Cost Per Acquisition (CPA) measures the total cost of acquiring a single customer through your advertising efforts. Ideally, you should include all related expenses, not just ad spending, such as creative costs and associated fees. However, for a more focused analysis, you can calculate CPA using only your ad spend.
You can calculate this metric by taking the total ad spend divided by the number of new customers gained.
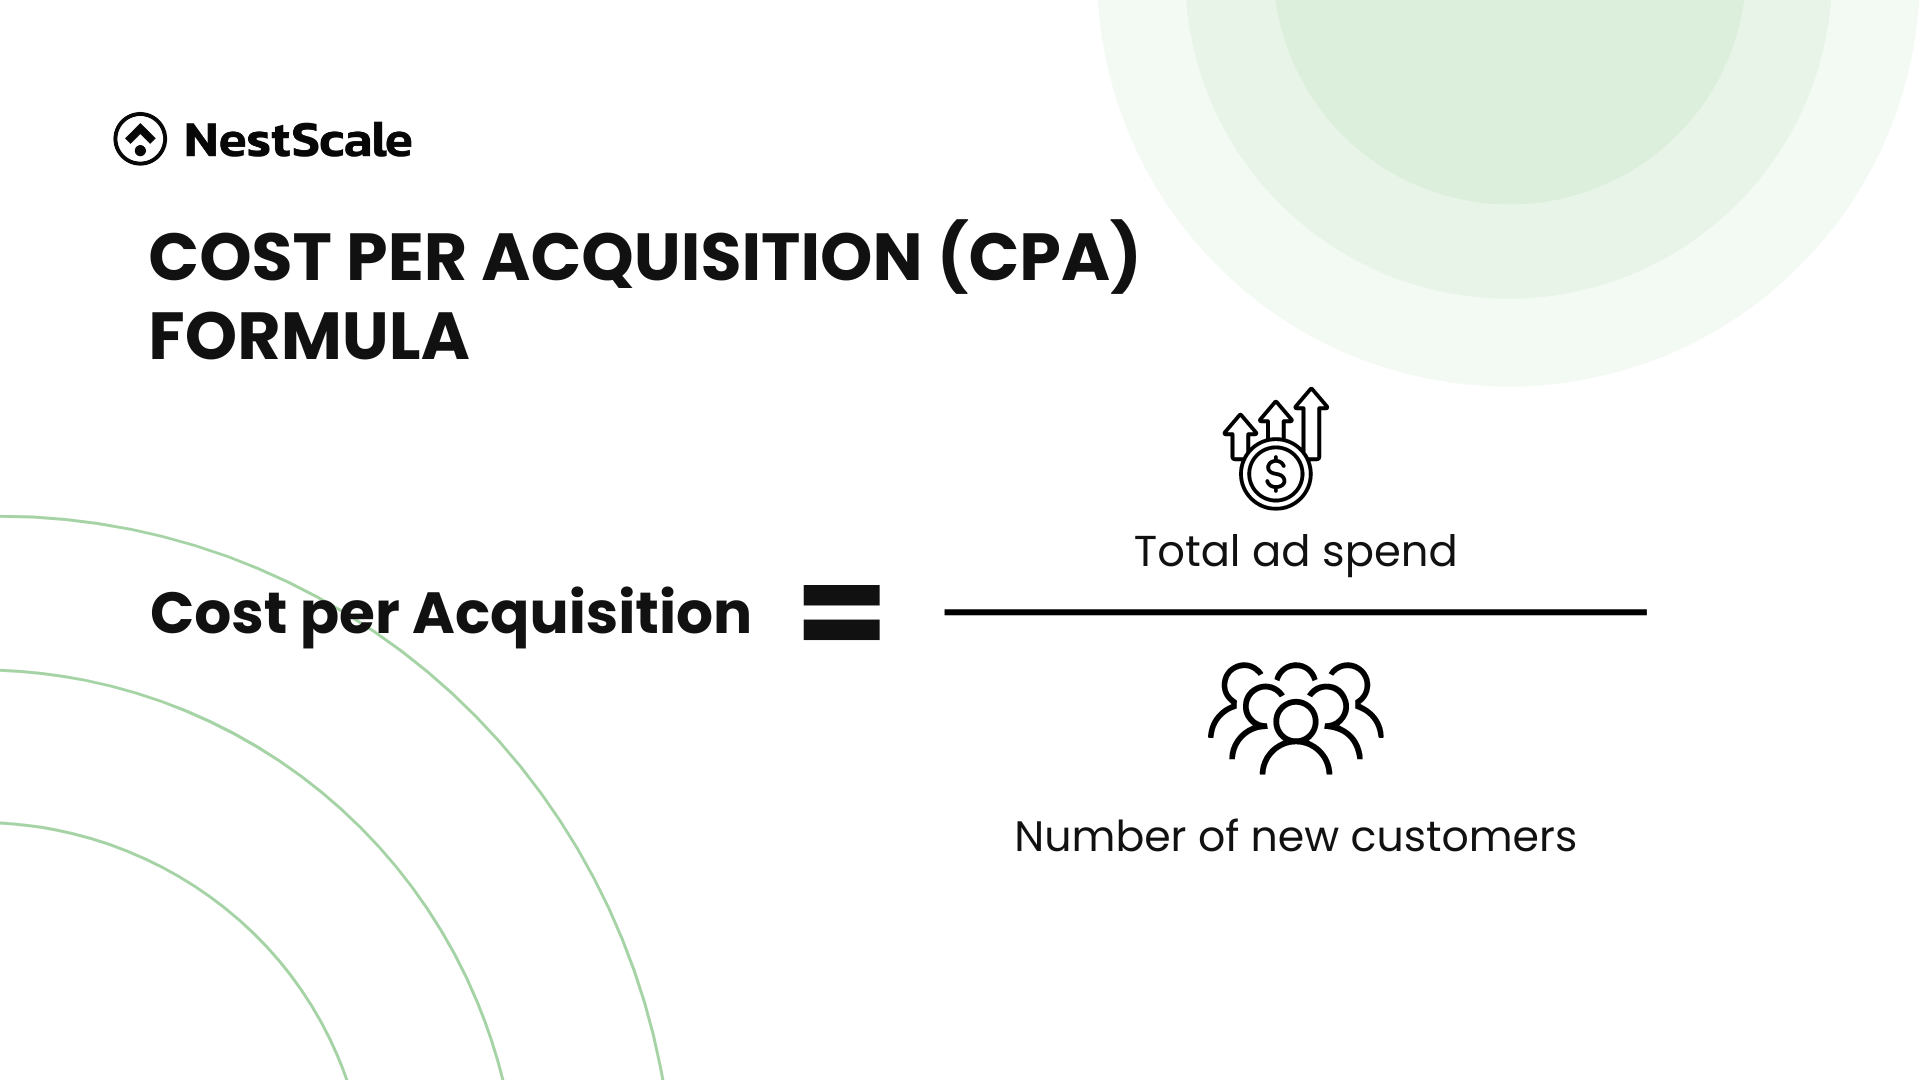
CPA is vital as it measures your marketing spend’s efficiency. Tracking it reveals which advertising channels are most cost-effective, allowing you to allocate your budget smarter. By understanding your CPA, you can focus on channels that perform well and reconsider underperforming ones. This helps refine your strategies and improve customer acquisition efficiency.
Engagement metrics
Once you’ve acquired visitors to your site, the next step is to engage them. These metrics will help you understand how effectively your content captures and retains their interest.
Click-through rate
Click-through rate (CTR) measures the percentage of people who click on your content or ad after seeing it. It’s applicable to email campaigns, social media posts, and organic search, but it’s especially valuable for assessing the effectiveness of paid advertising.
CTR is calculated with the formula: Number of clicks / Number of impressions x 100
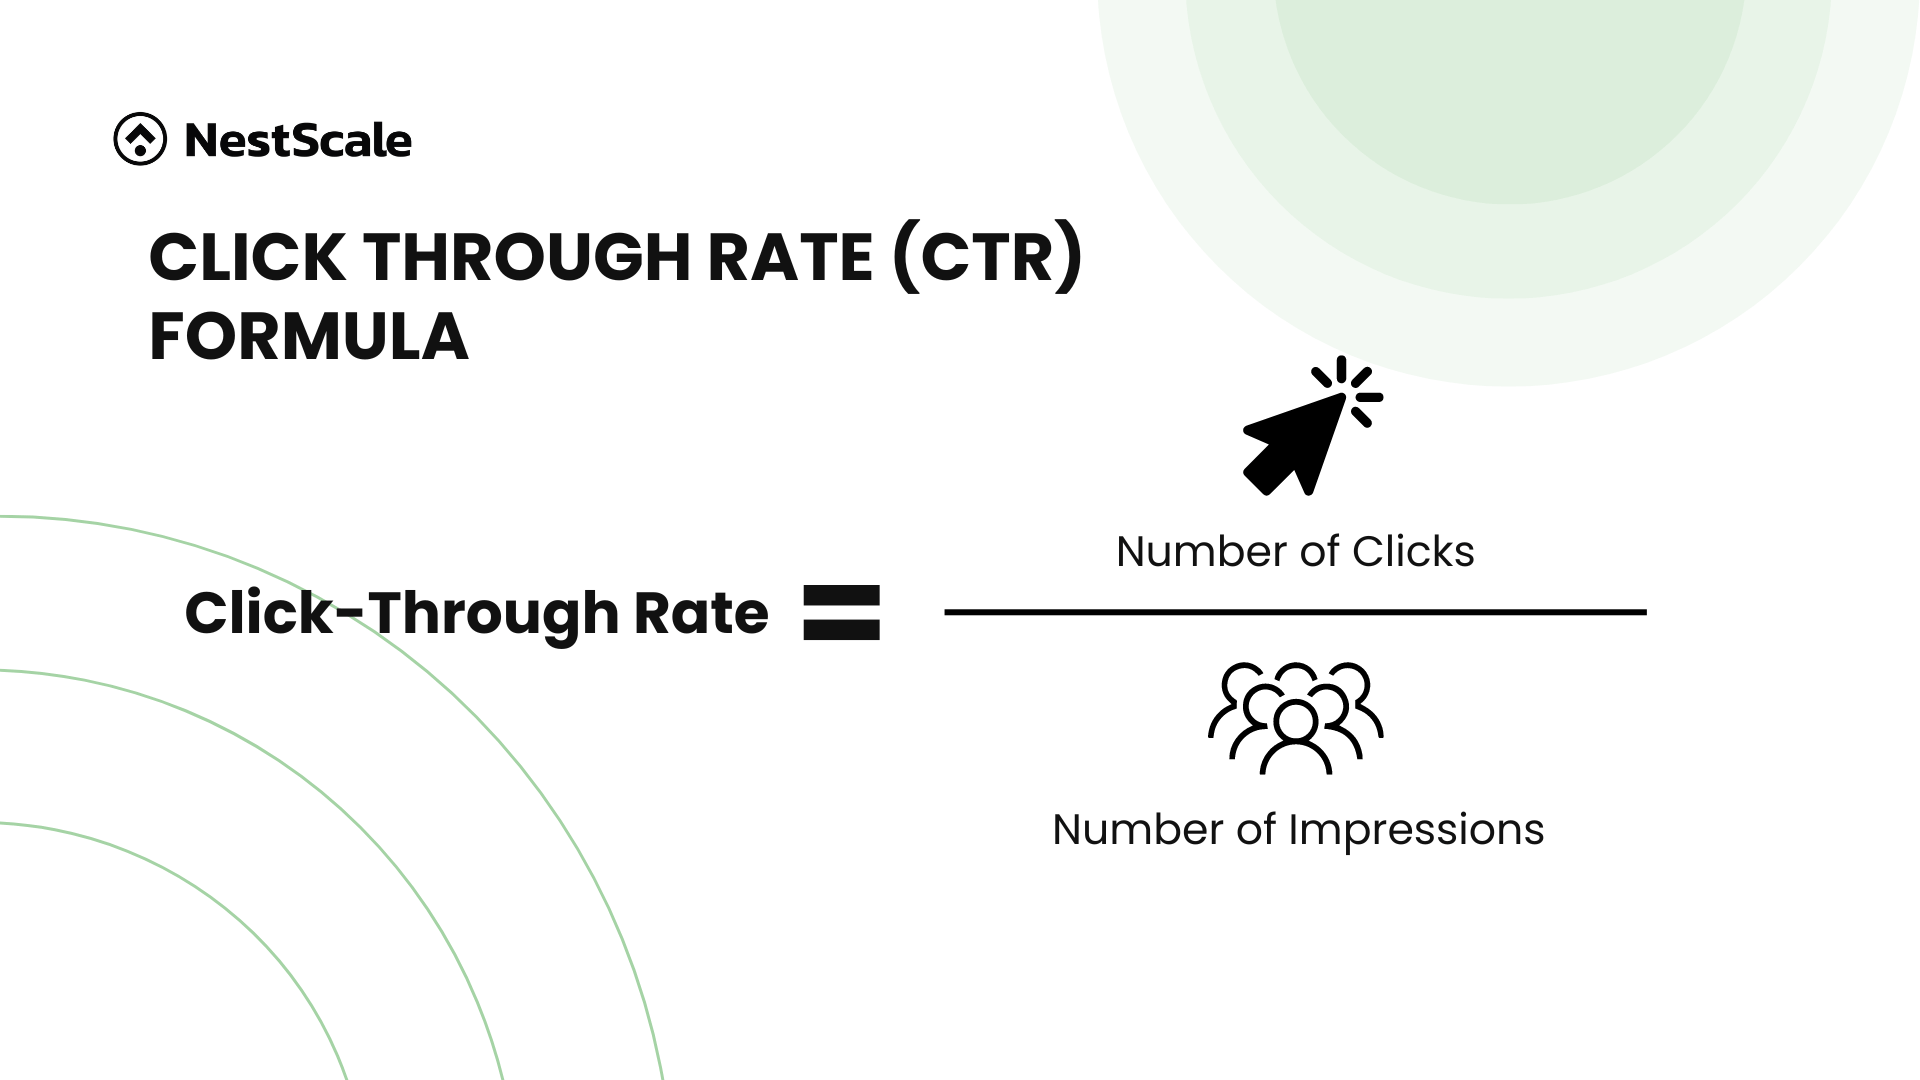
A high CTR indicates that your ad is compelling and relevant, showing that your message resonates with your audience and prompts action. This reflects the success of your ad copy, design, and targeting strategy. Generally, a higher CTR leads to better ad performance and more efficient budget use.
In e-commerce, a good CTR depends on the platform and industry, but a rate of around 2-3% is typically considered average. This benchmark helps you evaluate your performance and set realistic campaign goals.
Engagement
Engagement refers to how users interact with your content through likes, comments, shares, and saves across various platforms like social media and blogs. This measure gives a comprehensive view of your content’s performance, indicating how well it resonates with your audience.
High engagement means your content is not just viewed but actively interacted with. This ongoing interaction can lead to more conversions and sales. Additionally, platforms often prioritize highly engaged content in their algorithms, enhancing your visibility and reach, and providing even greater exposure for your brand.
Bounce rate
Bounce rate is the percentage of visitors who leave your website after viewing only one page. It measures how many people “bounce” away without engaging with other content or navigating to other pages.
Bounce rate can reflect how well your website is performing in terms of user experience (UX). By analyzing this metric, you can identify areas of your site that need improvement to better engage your customers. Questions like “Is your payment flow convenient?” or “Does your blog attract and meet customer needs?” can be partly answered by looking at this metric. Therefore, monitoring and improving your bounce rate is essential for enhancing user experience and maximizing the effectiveness of your digital presence.
Conversion metrics
Engagement is crucial, but conversions are where your efforts truly pay off. These metrics will help you measure and optimize your conversion rates.
Sales conversion rate
The sales conversion rate is the percentage of visitors to your website who complete a purchase. It measures how effectively your site or ads turn visitors into paying customers.
The sales conversion rate is calculated using the formula: (Number of purchases / Number of visitors) x 100.
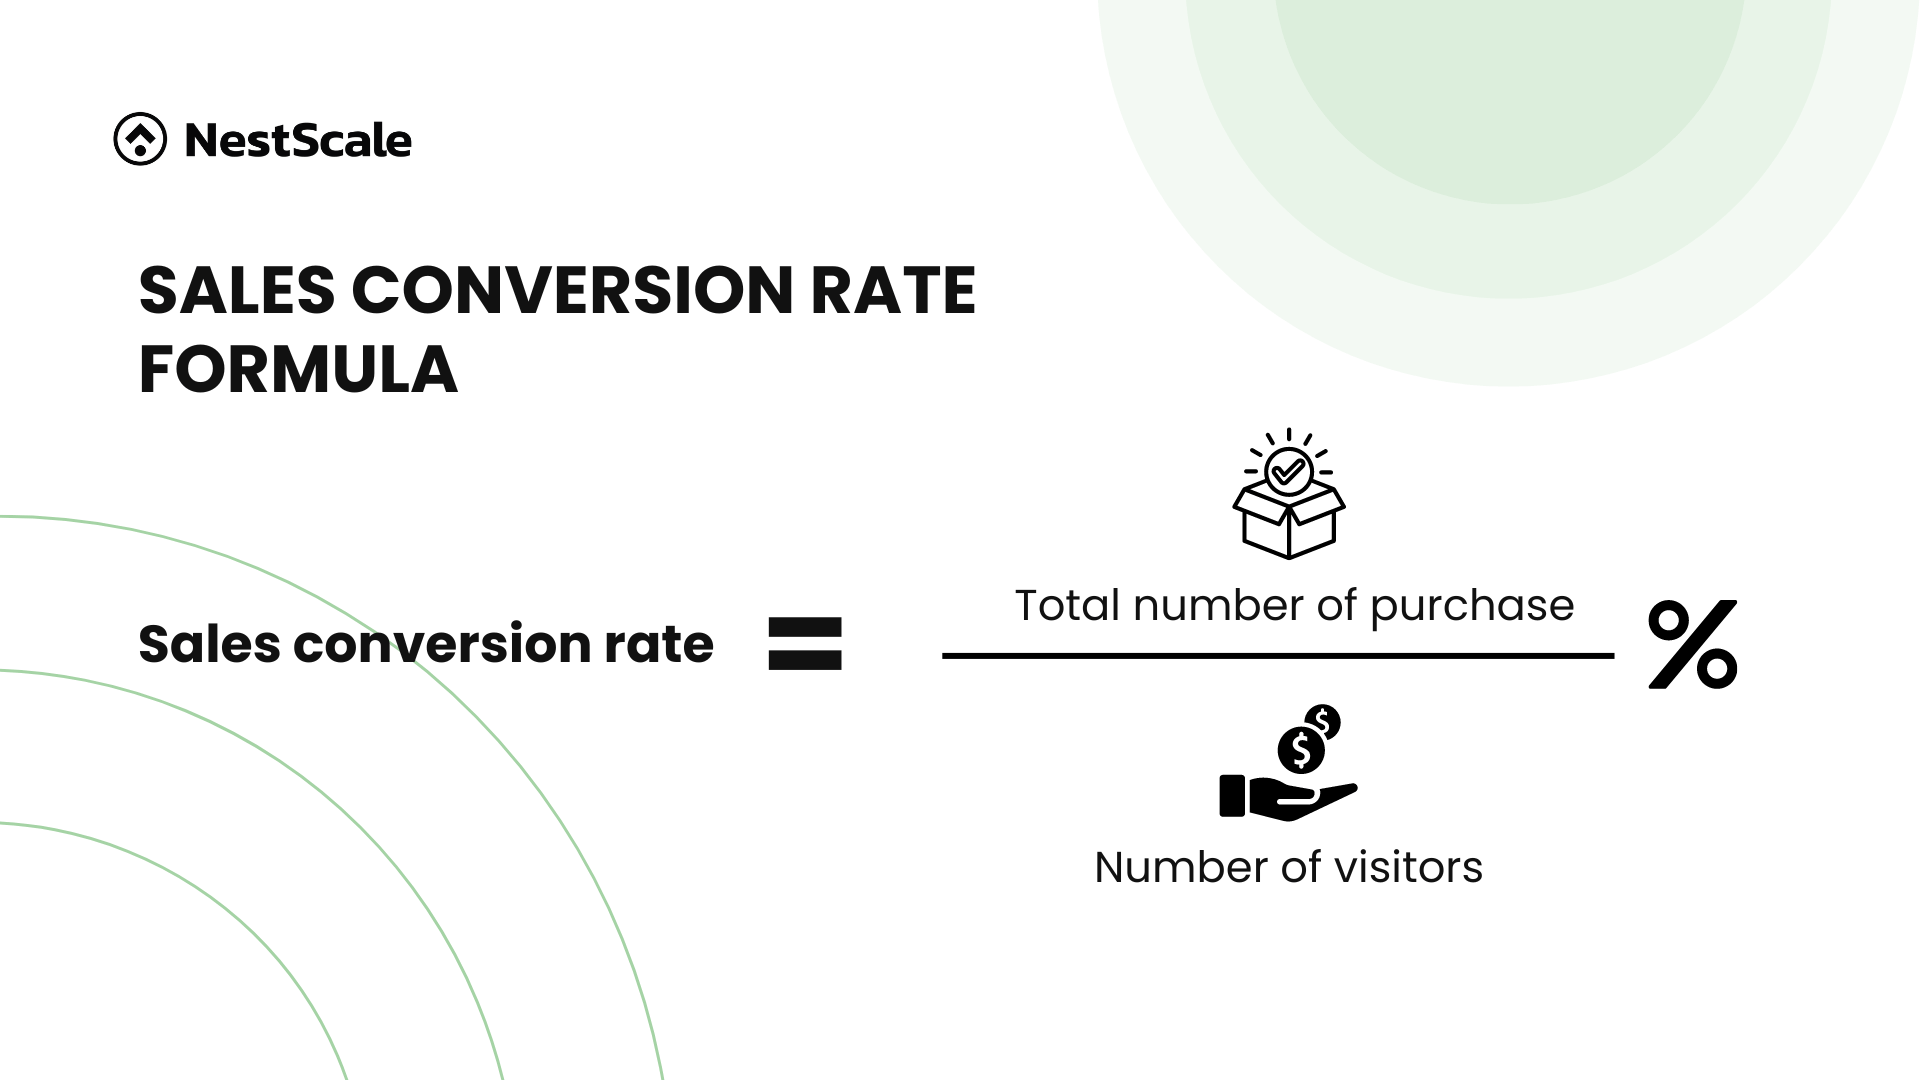
This metric directly impacts your revenue. A higher sales conversion rate indicates that your marketing efforts are effective and that your website provides a seamless shopping experience. An optimized conversion rate means you’re successfully guiding visitors through the purchasing journey, from landing on your site to completing a sale.
An average purchase conversion rate is around 2.5-3%, according to Shopify. By continuously monitoring and optimizing your sales conversion rate, you can enhance your marketing strategies, improve user experience, and ultimately drive more sales and revenue.
Average order value
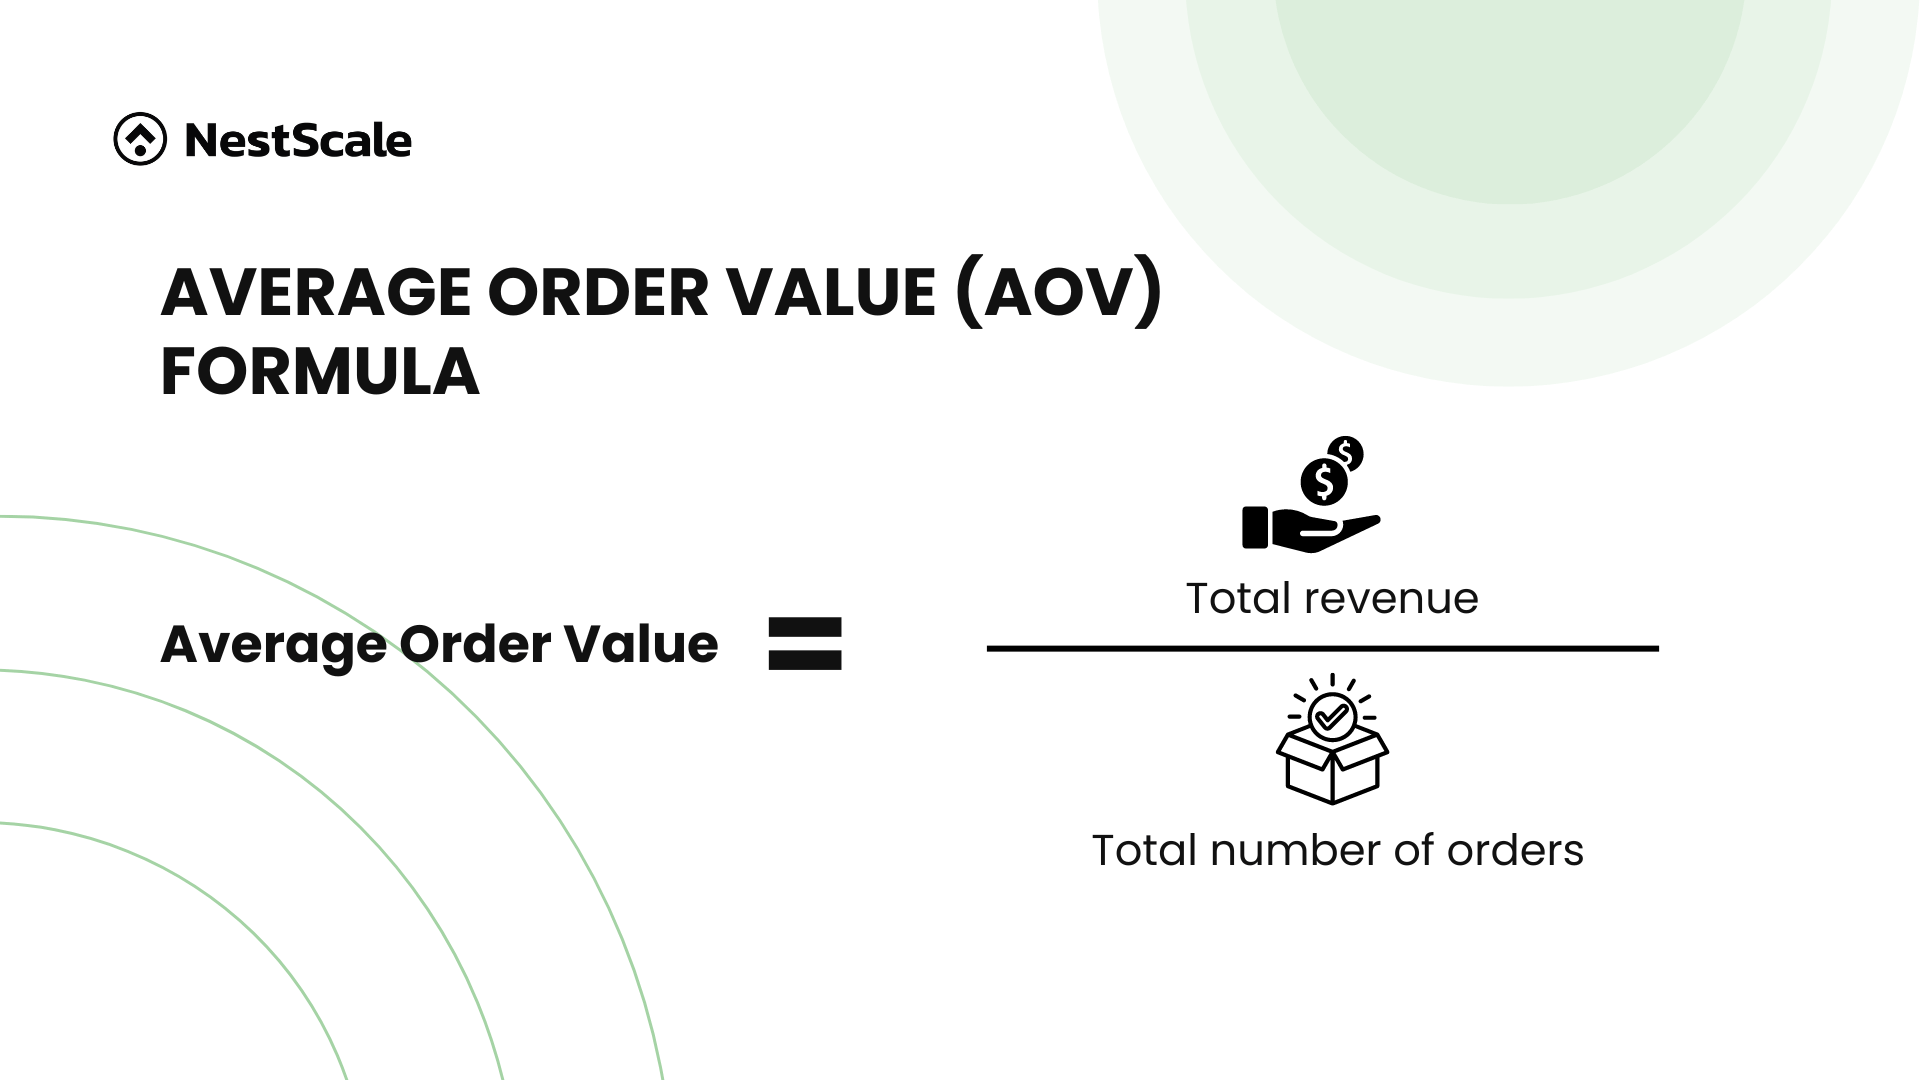
Average Order Value (AOV) is the average amount spent each time a customer places an order on your website. It helps you understand typical spending behavior per transaction.
AOV is crucial because it shows how much revenue you generate from each order, indicating the health of your sales strategy. When starting out, you might not have high traffic, so maximizing the value of each visitor is essential. Without tracking AOV, you can’t measure the effectiveness of these strategies.
Monitoring your AOV allows you to set realistic revenue goals and make informed decisions about marketing and sales tactics. Increasing your AOV can boost your revenue without needing to acquire new customers, making it a cost-effective way to enhance profitability.
AOV is calculated using the following formula: Total revenue / Total number of orders
Add to cart
Add to Cart refers to the action visitors take when they add products to their shopping cart on your website. It measures initial interest and purchase intent.
This metric is crucial because it indicates the level of interest in your products. If the number of these actions is lower than expected, you should analyze where the problems might lie. A low number might suggest issues with your product pages, pricing, or how you present your products.
Top products by units sold
Top Products by Units Sold refers to the products that generate the highest sales volume in terms of the number of units sold.
Identifying your best sellers is key to understanding customer preferences and managing inventory. Knowing which products are most popular helps you decide how much stock to keep, plan marketing strategies, and develop new products. By focusing on these top items, you can better meet customer demand, manage inventory efficiently, and boost sales and profitability.
ROAS
Return on Ad Spend (ROAS) measures the revenue generated for every dollar spent on advertising. It’s a critical metric for evaluating the efficiency and effectiveness of your ad campaigns.
ROAS is calculated using the following formula: Revenue from ads / Cost of ads
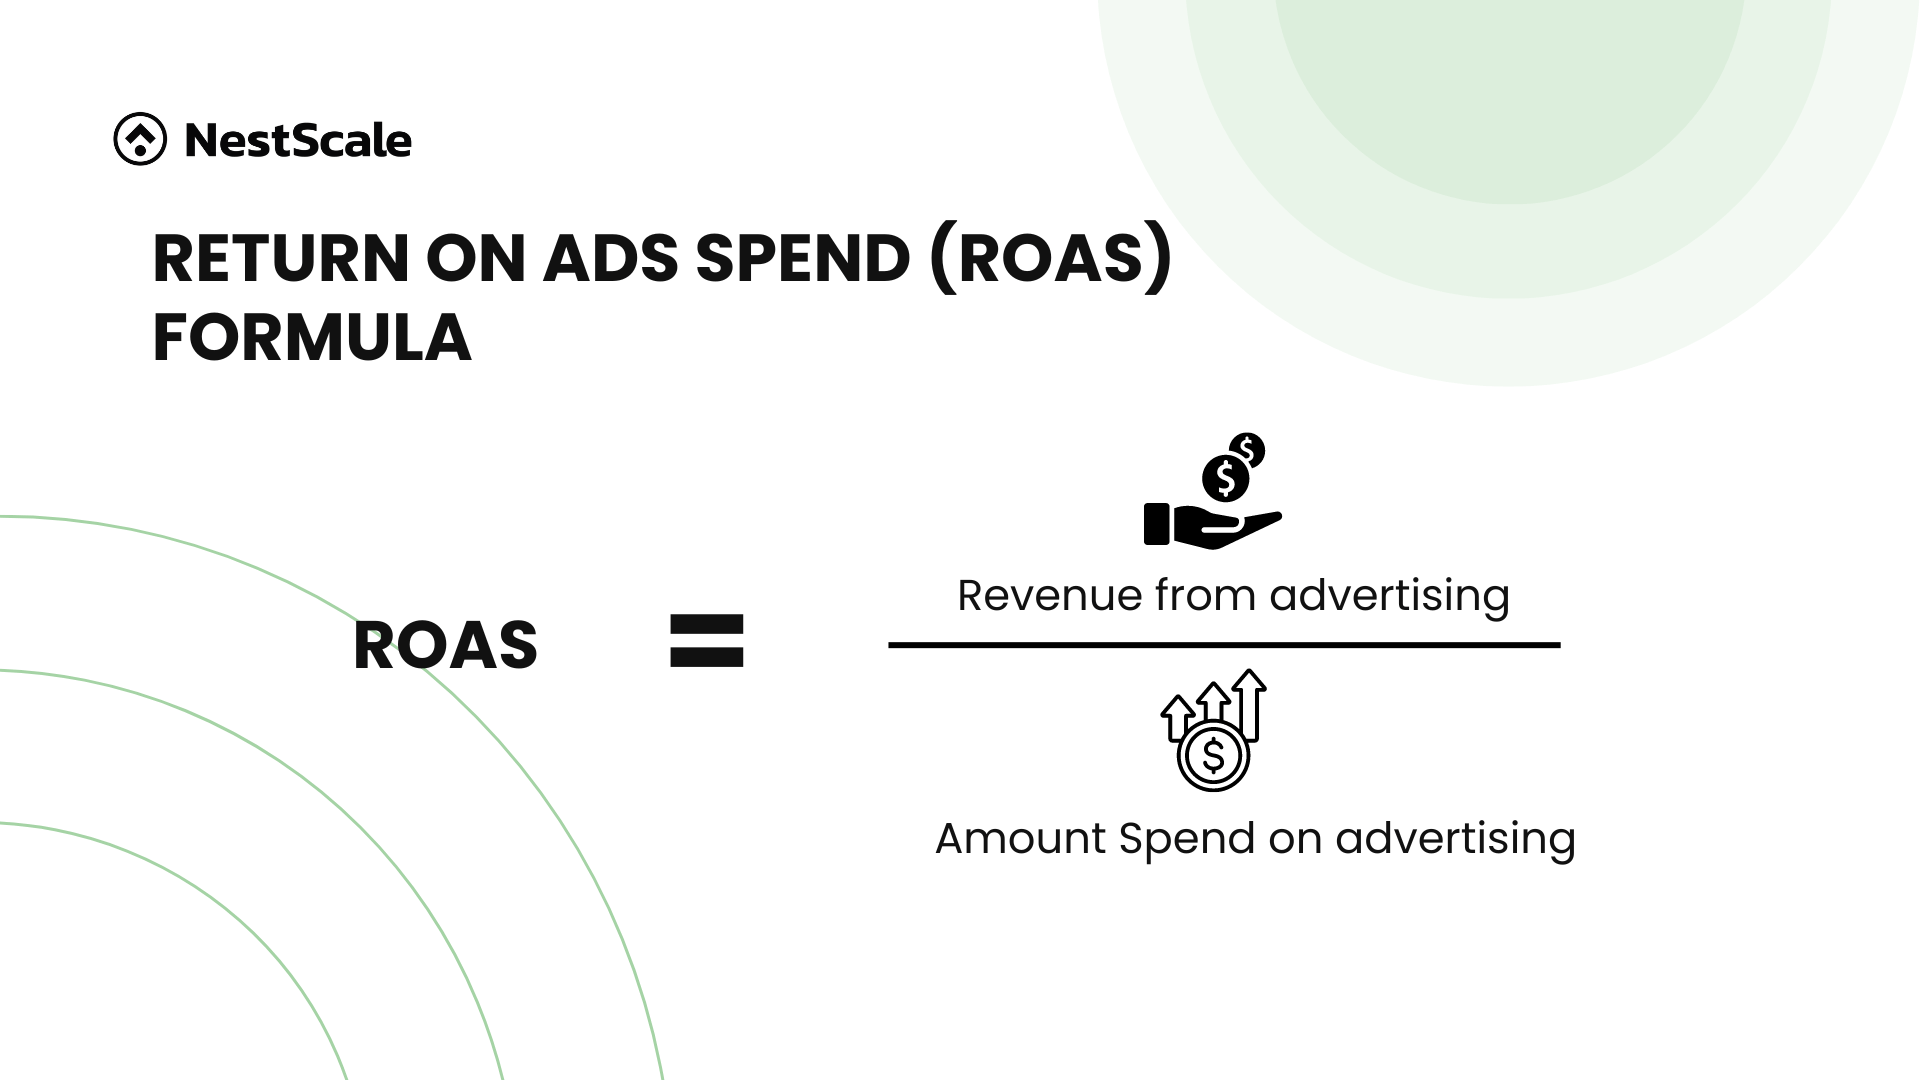
For instance, if you generate $200 from $100 spent on advertising, your ROAS would be $2. This means you earn $2 for every $1 spent on advertising.
ROAS is essential for understanding how well your ads are performing. A high ROAS indicates that your advertising efforts are yielding substantial revenue relative to what you’re spending. This helps you avoid spending more on advertising than you make in return, which can be disastrous for your business.
Generally, a ROAS of 4:1 is considered strong across many industries. This means for every $1 spent on advertising, you should aim to generate $4 in revenue. However, it’s important to consider your specific industry standards and business goals when evaluating your ROAS.
Retention metrics
Retaining customers is often more cost-effective than acquiring new ones. Retention metrics help you understand how well you keep your customers coming back.
Customer lifetime value (CLV)
Customer Lifetime Value (CLV or CLTV) is the total revenue a business can expect from a single customer over their entire relationship with the company.
Understanding CLV is crucial for making informed decisions about customer acquisition and retention. By knowing your customers’ long-term value, you can allocate marketing and sales resources more effectively, focusing on strategies that maximize profitability. A high CLV indicates strong customer loyalty, repeat business, and effective retention strategies.
To measure and optimize CLV, consider using tools and software that assist with data collection, analysis, and calculation. These tools can automate the process, provide accurate insights, and help you develop better retention strategies.
Net promoter score (NPS)
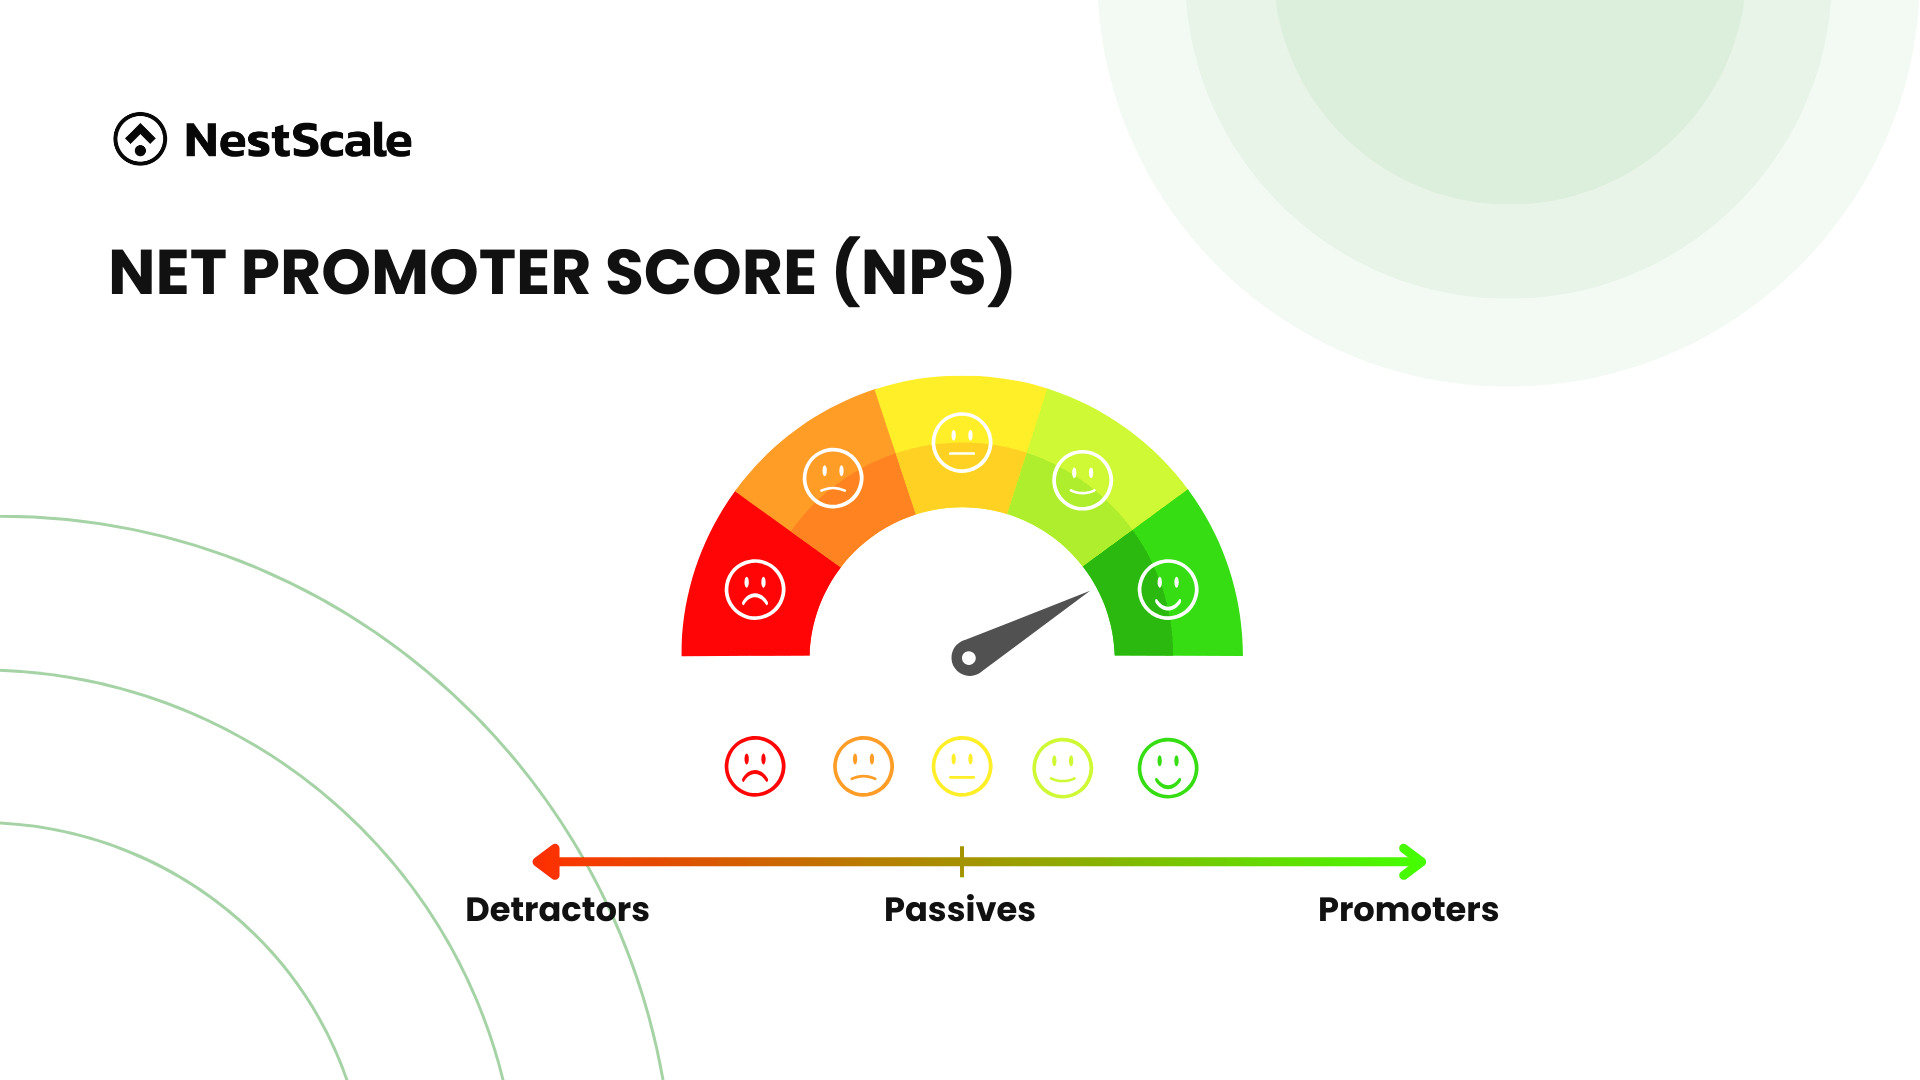
Net Promoter Score (NPS) measures customer satisfaction and loyalty by asking how likely customers are to recommend your business to others. It’s a widely used metric to gauge overall customer sentiment.
NPS is typically measured through customer surveys at checkout or other key interaction points. You can ask customers some questions such as On a scale of 1 – 10, how satisfied are you with the purchase?
Responses are usually categorized into three groups:
- Promoters: Ratings of 9-10
- Passives: Ratings of 7-8
- Detractors: Ratings of 6 or less
NPS is calculated by subtracting the percentage of Detractors from the percentage of Promoters. For example, if 70% are Promoters and 10% are Detractors, the NPS is 60.
A high NPS indicates strong satisfaction and loyalty, leading to organic growth through referrals. Regularly measuring NPS helps you identify strengths and weaknesses in your customer experience, showing you exactly where to improve.
Churn rate
Churn Rate is the percentage of customers who stop purchasing from your business over a given period. It measures how quickly you lose customers and is a key indicator of your business’s health and customer satisfaction.
A high churn rate can hurt your profitability. Retaining existing customers is usually more cost-effective than acquiring new ones, as loyal customers tend to spend more and refer others. Understanding and reducing churn is essential for sustained growth and long-term success.
By monitoring your churn rate, you can identify issues early and take steps to improve customer retention. This can include enhancing customer support, improving products, personalizing interactions, and deploying effective marketing and loyalty programs.
How to monitor the metrics?
With e-commerce platforms like Shopify, you can monitor key sales metrics such as products sold, revenue, and profit. However, you might miss deeper insights from metrics like CLV, ROAS, or CPA. Therefore, it’s recommended to monitor all your e-commerce metrics in one dashboard for a holistic view.
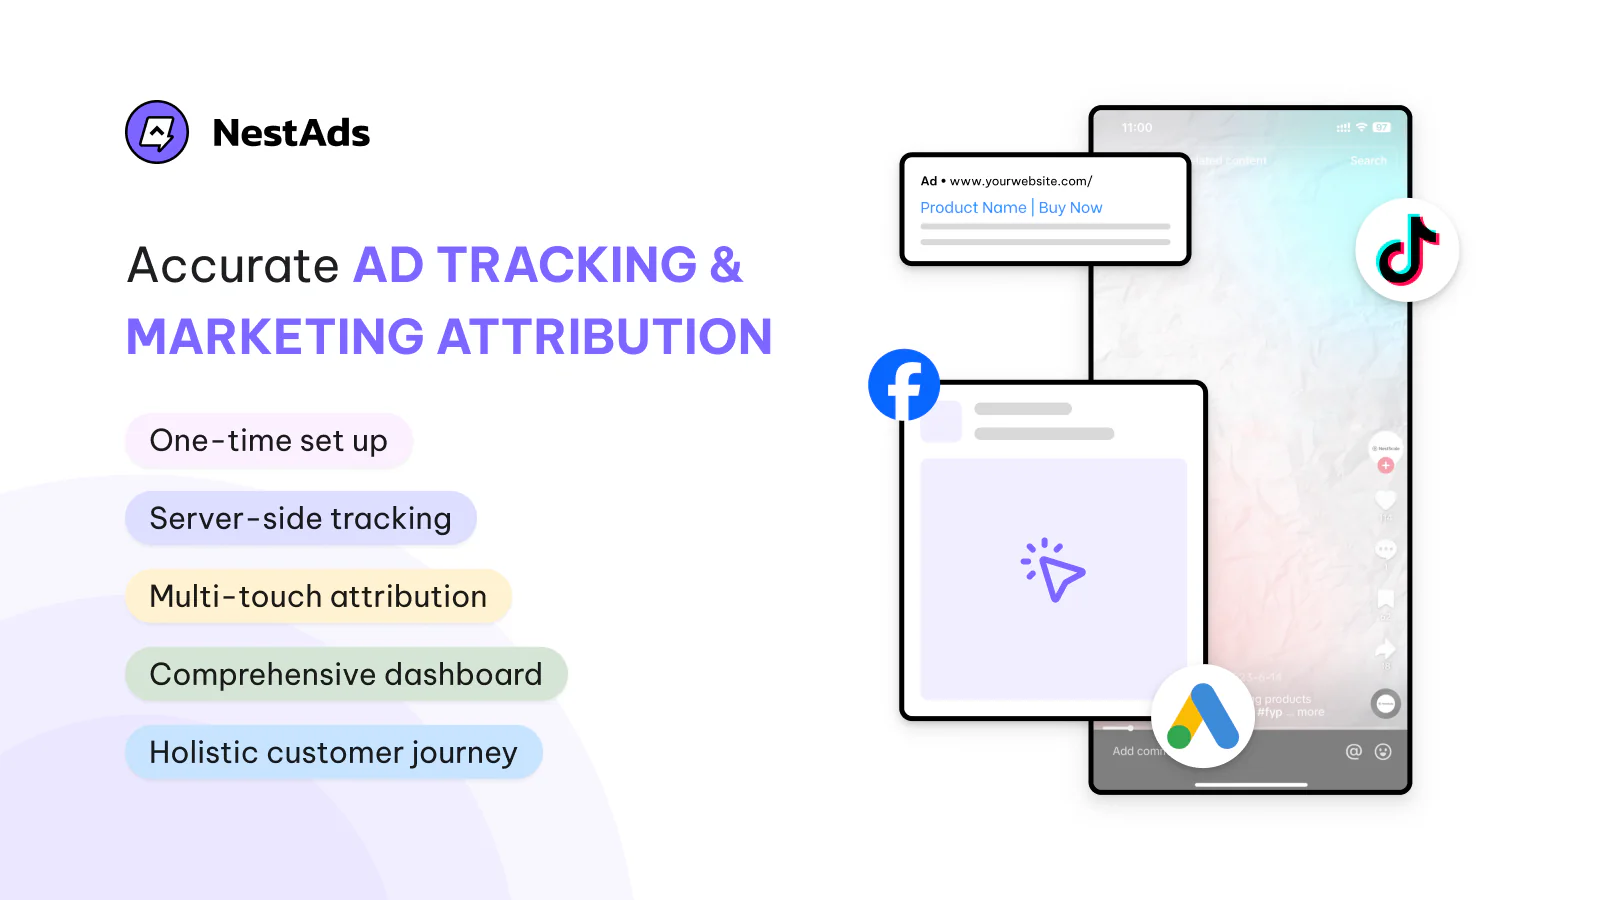
You can manually create a spreadsheet to gather all data, but to save time and effort, consider using a tool to help manage this task. Choose a tool that offers good visualization and accurate ad tracking to minimize the time spent on monitoring. For example, tools like NestAds provide visualized customer journeys, marketing attribution, and first-party data tracking for accurate insights. If you’re going to invest, make sure you choose the right tool.
Start your tracking journey now!
Understanding and tracking the right e-commerce metrics and KPIs is essential for driving your business forward. By focusing on these key areas—acquisition, engagement, conversion, and retention—you can gain valuable insights, optimize your strategies, and achieve sustainable growth. Remember, the metrics that matter most will depend on your unique business goals and customer journey, so tailor your approach accordingly. Use this guide as a starting point to harness the power of data and propel your eCommerce business to new heights.