

Google Analytics 4 (GA4) offers its users a powerful toolkit for tracking and analyzing user interactions. One of the key potentials that GA4 provides is the ability to create custom reports. These reports allow you to tailor your data analysis to meet your specific needs and provide deeper insights into your data.
In this guide, we’ll explore the advantages and challenges of custom reports, how to create them, and best practices to get the most from your analytics. Whether you’re looking to optimize your marketing efforts or enhance user experience, mastering custom reports in GA4 can be a game-changer. Let’s dive into how you can leverage this powerful feature to drive your business forward!
Overview of custom reports in Google Analytics 4
GA4 is a powerful tool for tracking and analyzing user interactions on your website or app. One of the most valuable features of GA4 is the ability to create custom reports. These reports allow you to tailor your data analysis for your specific business needs, providing deeper insights into user behavior and helping you make more informed decisions.
Custom reports in GA4 are flexible, allowing you to focus on the metrics and dimensions that matter most to you. Whether you want to track specific user journeys, monitor custom events, or analyze the performance of your marketing campaigns, custom reports can help you achieve your goals.
Pros & Cons of custom GA4 reports
When creating custom reports in GA4, it’s important to understand both the platform’s capabilities and its limitations. Here’s a detailed look at what you can expect from using GA4 for custom reporting:
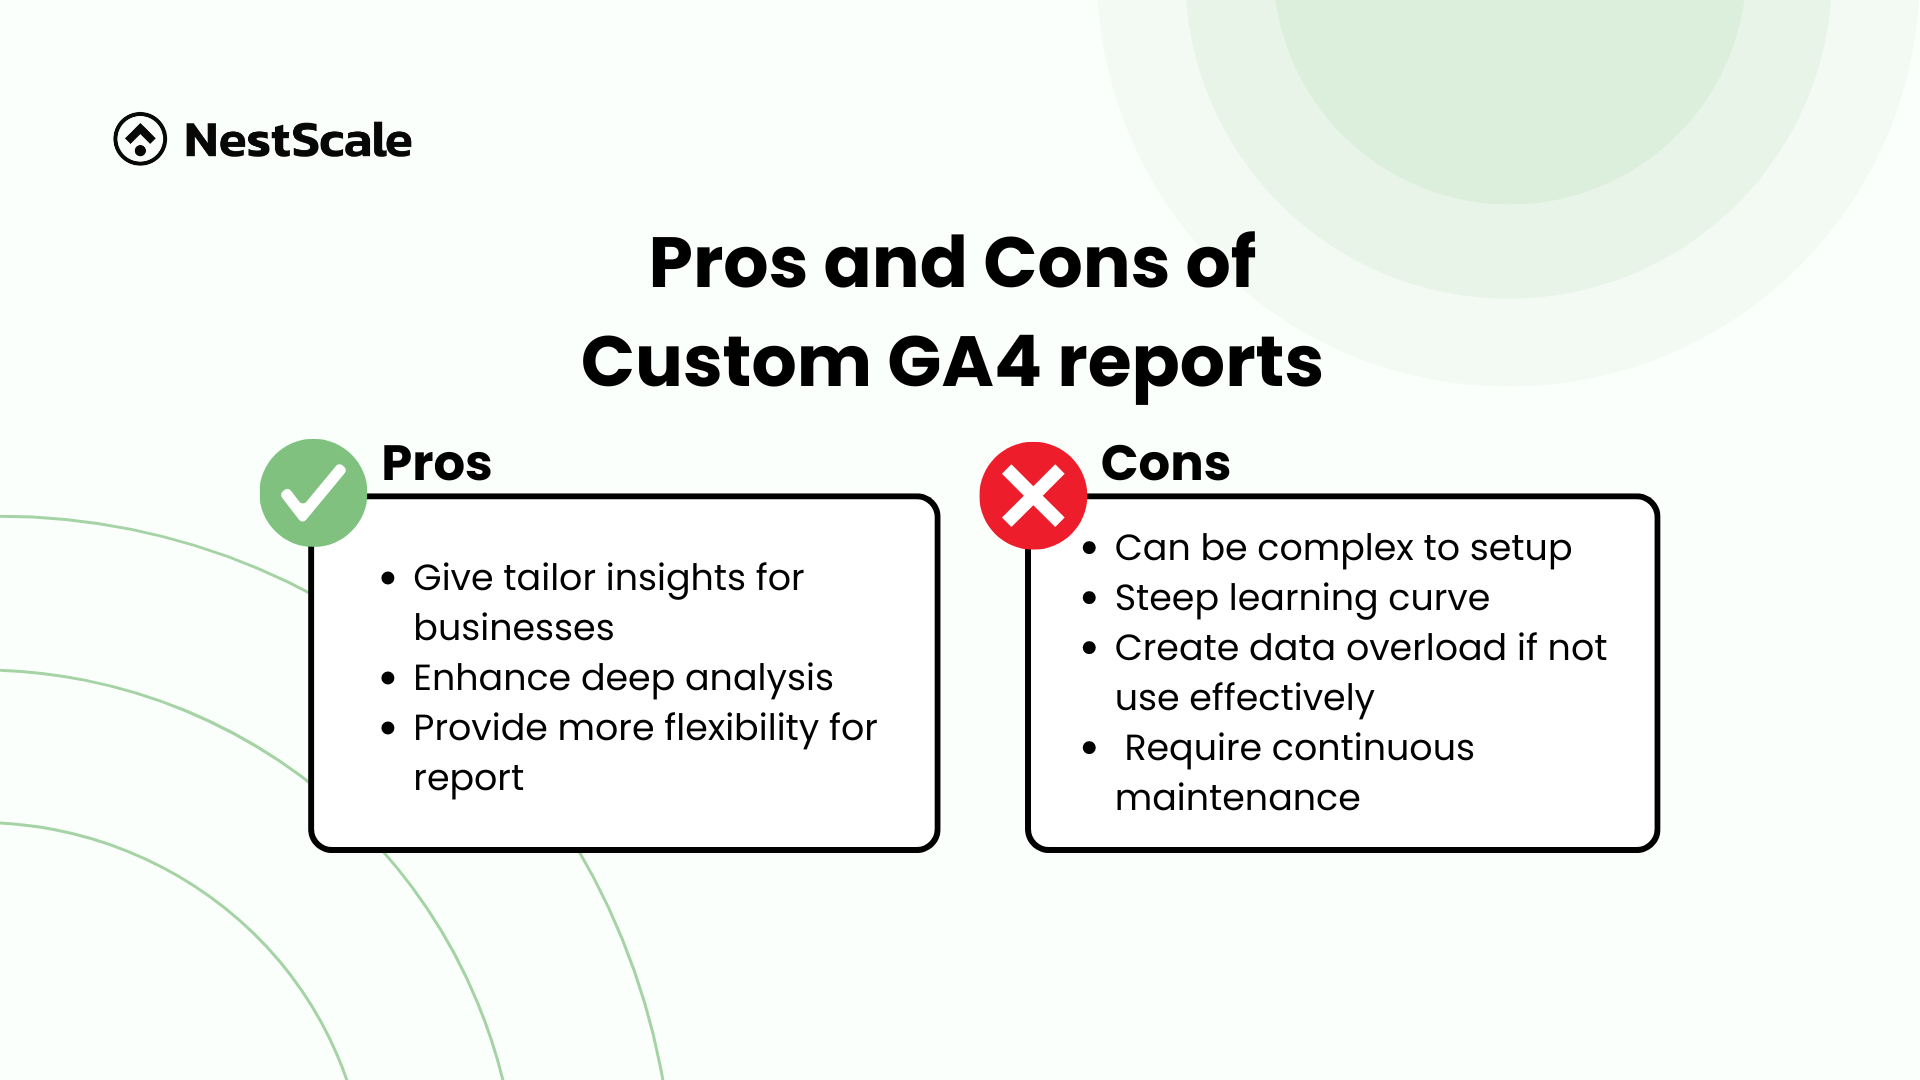
Pros
- Give tailored insights for businesses: Custom reports are designed to zero in on the specific metrics and dimensions that are crucial for your business. This targeted approach ensures that the insights you receive are not only relevant but also actionable, helping you to drive more targeted strategies based on precise data.
- Enhanced deep analysis: With the ability to create custom reports, you can dissect your data from multiple perspectives. This deeper analysis helps uncover hidden patterns, trends, and correlations that standard reports might overlook. By exploring these nuances, you gain a richer understanding of your business dynamics and customer behaviors.
- Provide more flexibility for reports: The custom reports in GA4 offer exceptional flexibility, allowing you to tweak and adjust your reports as your business needs change. This adaptability is crucial for staying responsive to market shifts or internal changes within your company.
Cons
- Can be complex to set up: The setup process for custom reports in GA4 can be complex, especially for those who are not deeply familiar with analytics tools. This complexity can act as a barrier, particularly for new users or those without technical expertise.
- Steep learning curve: Learning how to effectively create and manage custom reports requires a certain level of commitment and skill. New users might find this learning curve daunting, and may need additional training or support to fully utilize the capabilities of GA4.
- Create data overload if now used effectively: While the ability to track numerous metrics and dimensions is a powerful feature, it can also lead to information overload. Without careful management, you may find yourself overwhelmed by the volume of data. Eventually, this can obscure rather than clarify key insights.
- Require continuous maintenance: Unlike standard reports, custom reports require ongoing attention and maintenance. As your business evolves, your reports will need to be updated to reflect new priorities and changes in your data collection methods. This ongoing maintenance can demand significant time and effort to ensure accuracy and relevance.
How to create custom reports in GA4
To create custom reports in GA4, you have two options. You can either customize based on GA4’s default reports or create a brand new report tailored to your specific needs:
Create using the current report
- Choose one of the predefined reports. Then, customize the elements based on your needs.
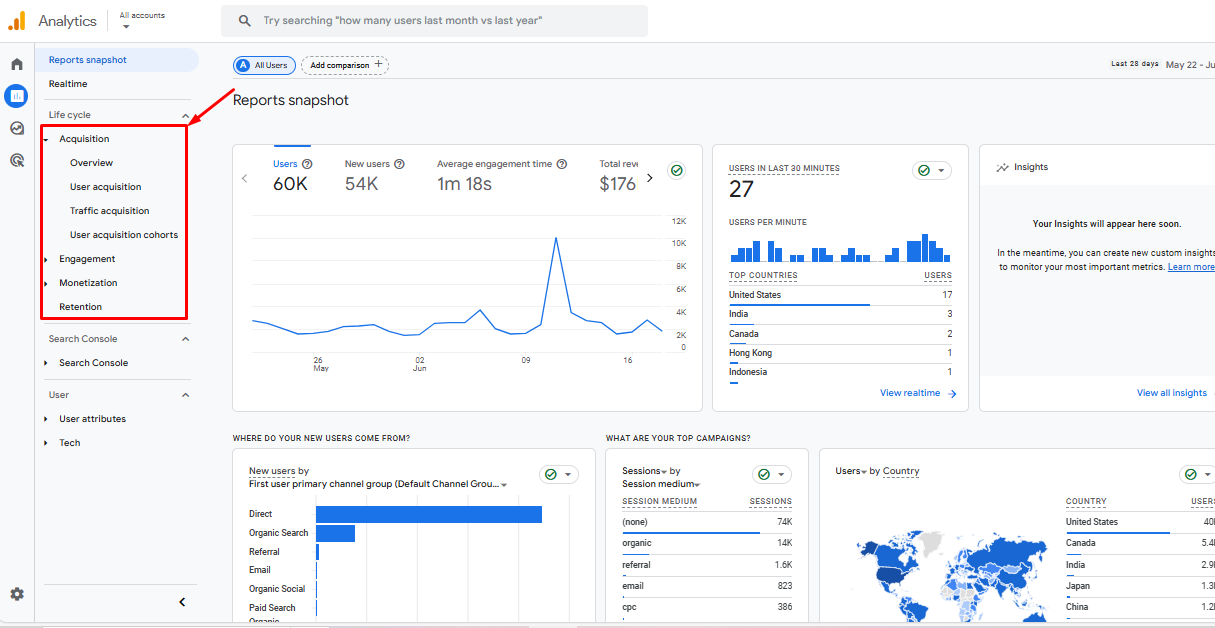
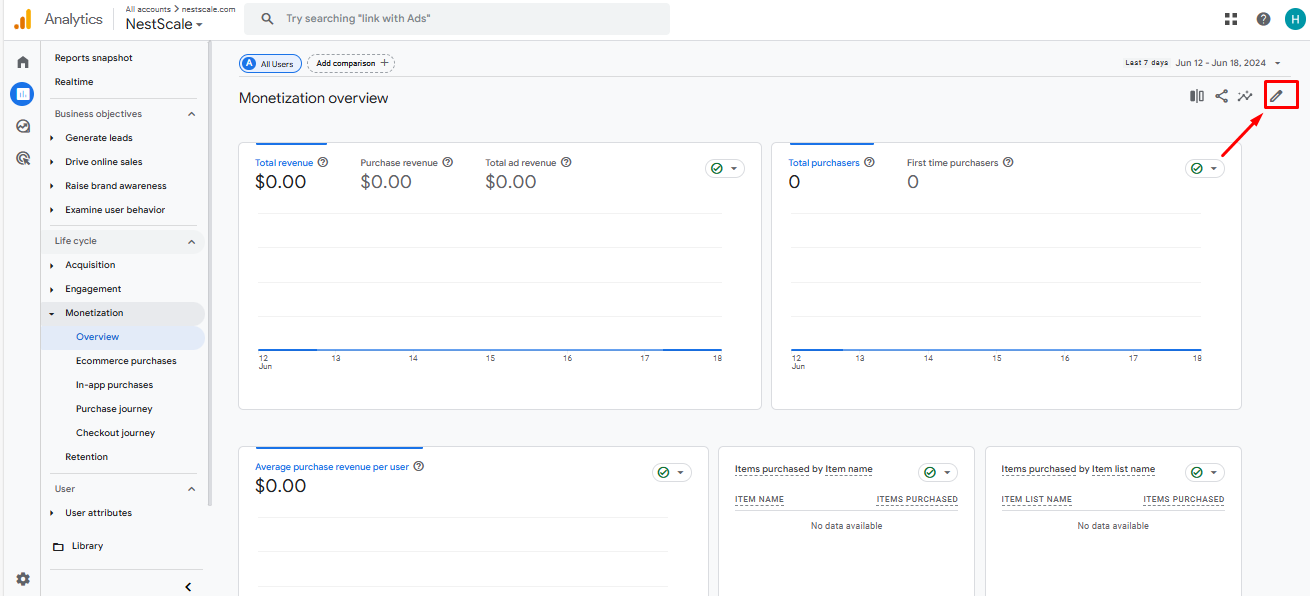
- Click on the Customize report icon.
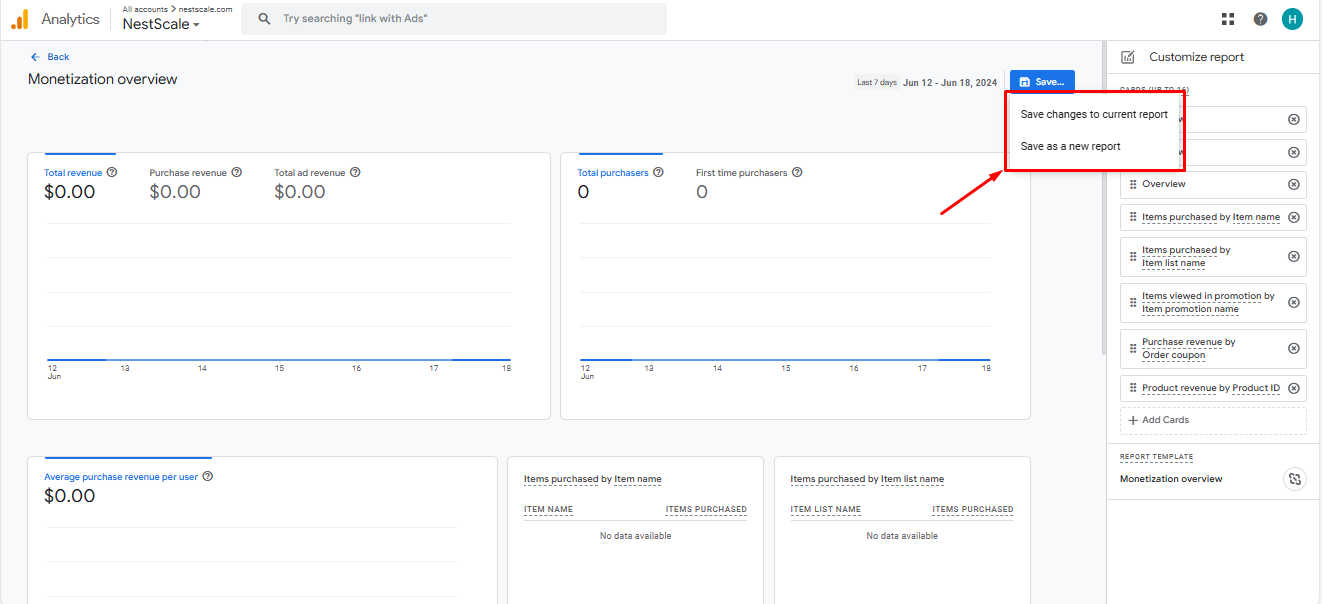
- Save your report. You have the option to Save as new report or Save to current report. If you’re setting up a view for ongoing monitoring, we recommend saving as a new report. Saving to the current report might cause you to lose important information previously included in the report or miss out on future updates.
Create a brand new report
If you prefer not to use the default view and want to create custom reports tailored to your specific needs, you can easily do so by starting a new report in Exploration. Here are the steps to follow:
1. Create a new report
Start by navigating to Exploration.
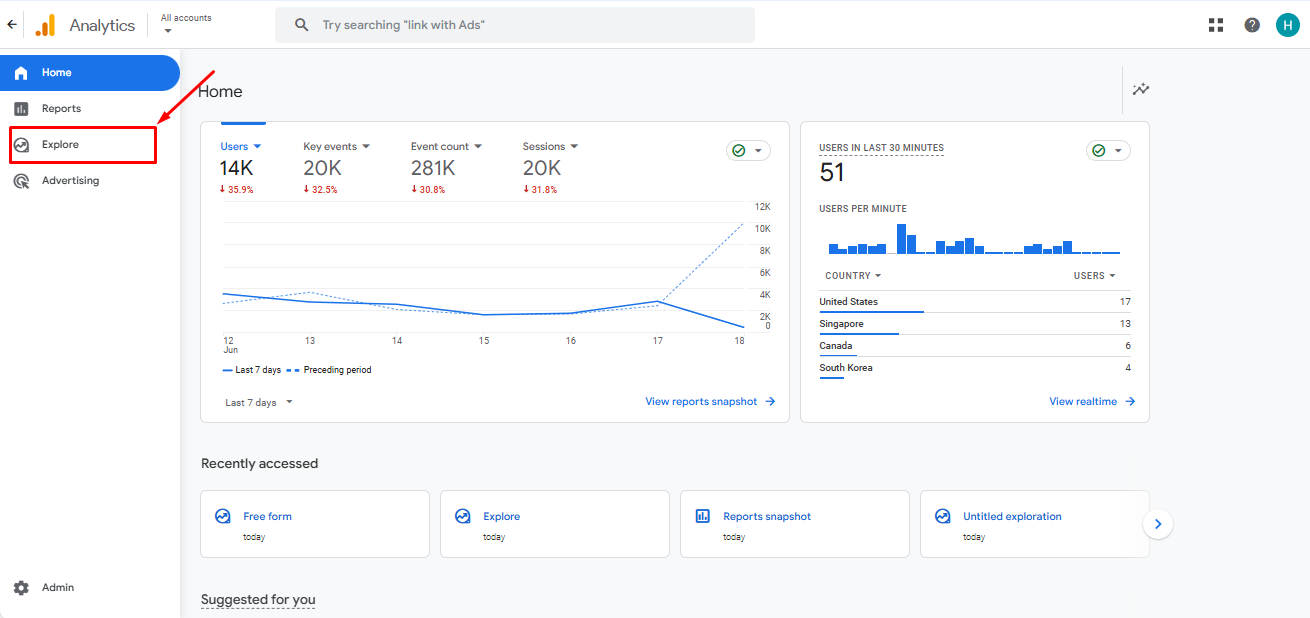
Then, click on either a Blank form or select from existing templates like Free form, Funnel exploration, or Path exploration.
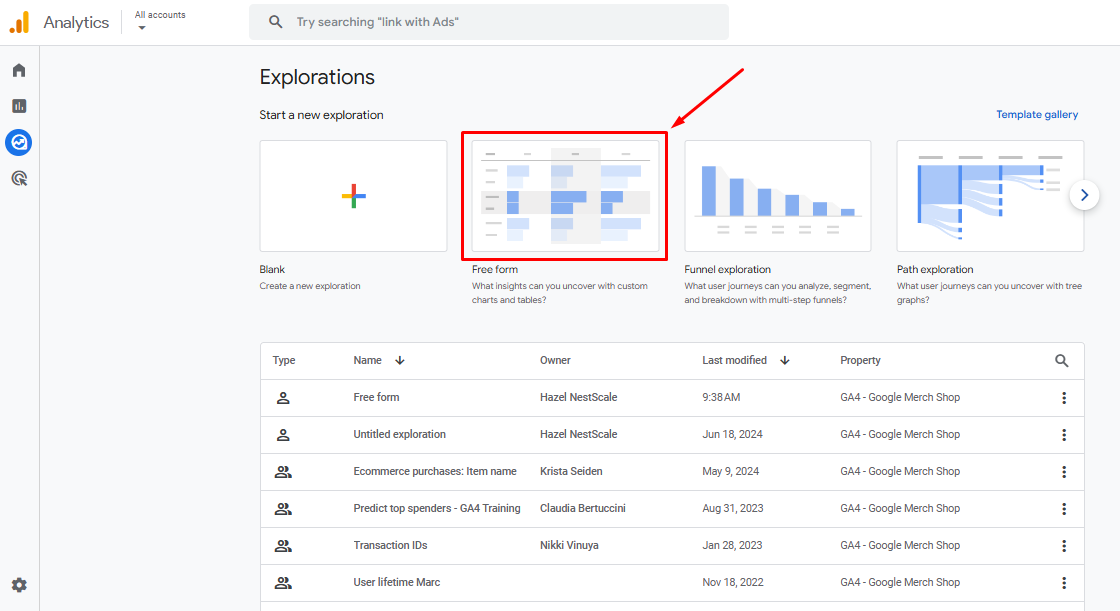
If you’re looking for extensive customization options, we recommend opting for the Free form. This template includes some basic, compatible metrics, making it easier for you to customize according to your needs.
2. Adjust the variables section
This section serves as the foundational component of your report. It allows you to select and manage the different data elements you want to analyze. In the variable section, there will be some of the main components you need to understand:
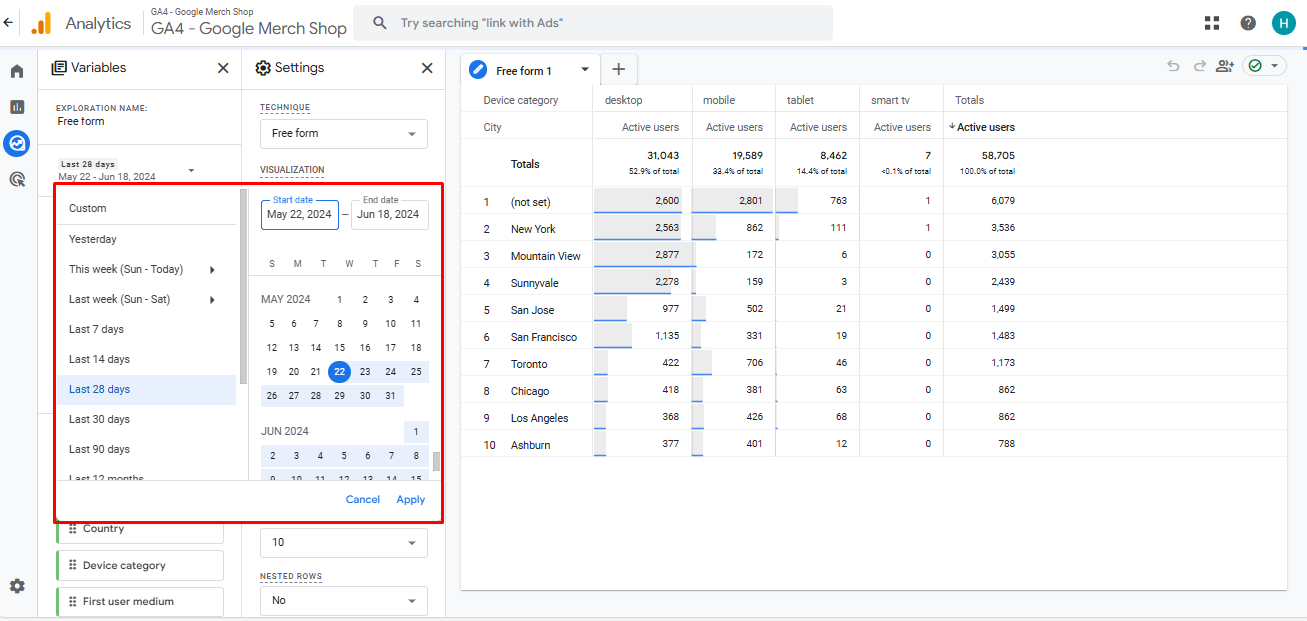
- Date: This option allows you to adjust the time frame for the data you want to analyze. You can choose from preset ranges or customize the dates to focus on periods relevant to your analysis.
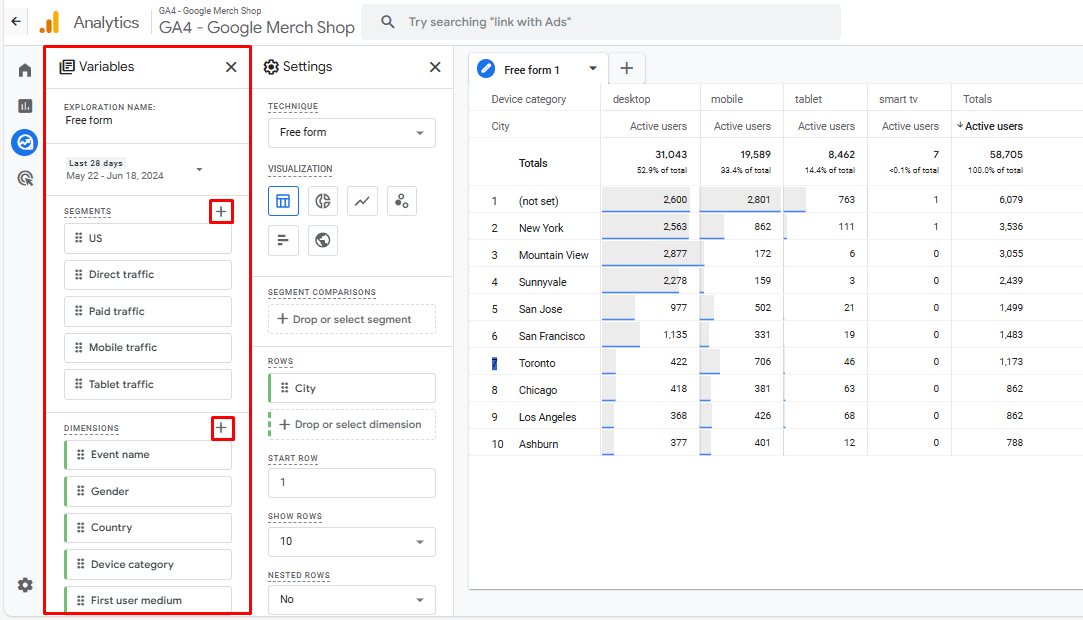
- Segment: This feature enables you to isolate and analyze specific subsets of your data. For instance, you can compare the behaviors of new versus returning customers.
- Dimensions: Dimensions are attributes of your data, such as traffic sources, page paths, and devices, which help you categorize and view your data in different ways.
- Metrics: Metrics are quantitative measurements of your data. Common metrics include sessions, conversions, and revenue, which provide insights into the performance of your site or app.
First, set the date range for your report. By default, it’s set to the last 28 days. However, you can initially leave the date as is and make changes later, after you’ve set up all the values and columns for your report. This flexibility allows you to focus on structuring your report first before finalizing the timeframe.
To track specific data, add the segments, dimensions, and metrics you’re interested in by clicking on the ‘+’ button. This allows you to customize your report with the exact information you need.
3. Customize the settings tab
The settings section is crucial for configuring how the variables are used to create visualizations and tables in your exploration. Here, you can manipulate and organize your data to generate meaningful insights. This area allows you to tailor how data is displayed, ensuring that the information presented aligns with your analytical goals.
Here are some of the components you need to understand before crafting your report:
- Segment comparison: This tool allows you to compare data across different segments directly in your report, helping you spot trends and outliers among different user groups.
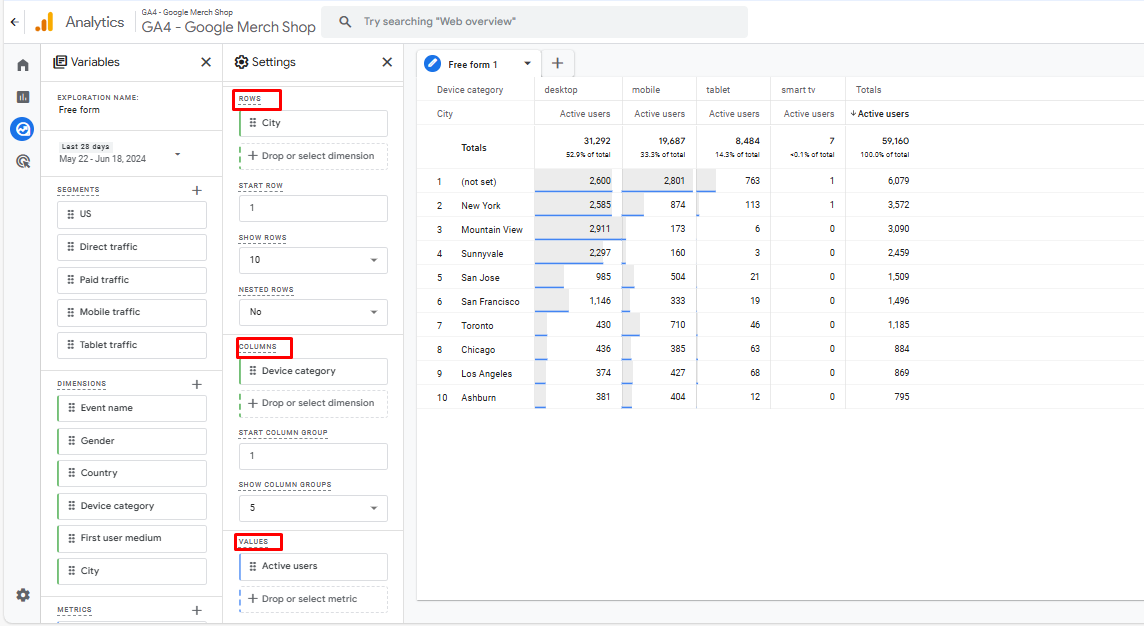
- Rows: Define which dimensions you want to display as rows in your tables or which data points to group together in visualizations
- Columns: Select dimensions for column display in tables or to differentiate data points in charts.
- Values: Specify which metrics to display in your tables or charts, determining how your data will be quantified in the reports.
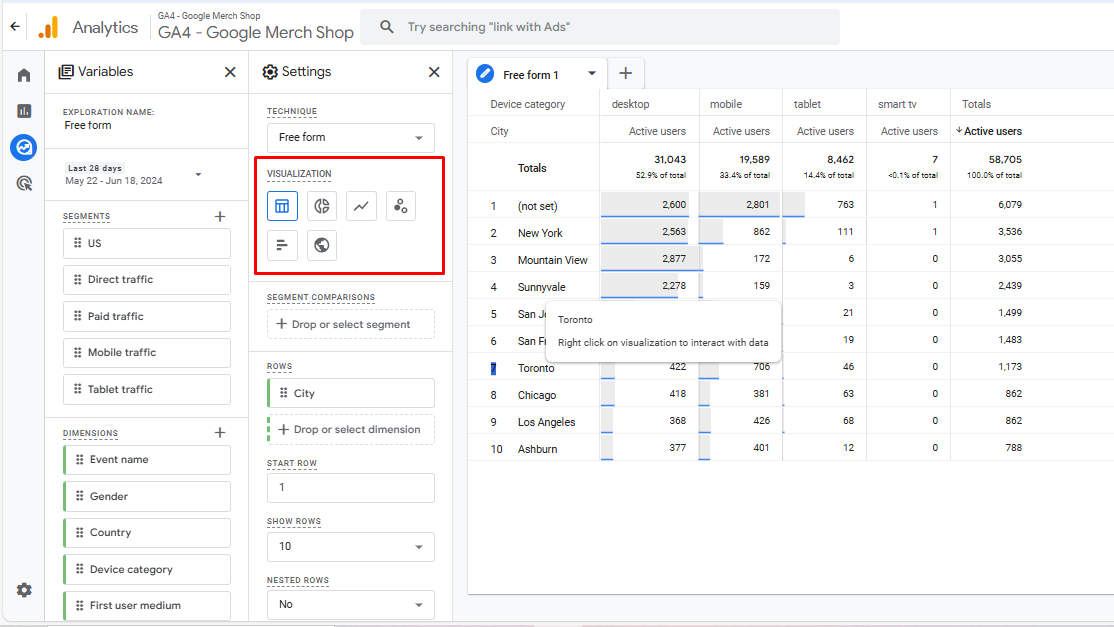
Choose how you want to visualize your data. You can display your data in various formats, including a table, donut chart, line chart, scatterplot, bar chart, or geo map.
Drag and drop the segment from the variable section into the segment comparisons. This step is optional, but it’s useful if you want to achieve a deeper comparative view of your data.
Adjust the data you want to display by dragging the dimensions and metrics from the Variables section to the tab settings. GA4 provides you with the descriptions for each component, so just follow it. For a table visualization, place the dimensions into the rows and columns and add the metrics as the variables you want to view.
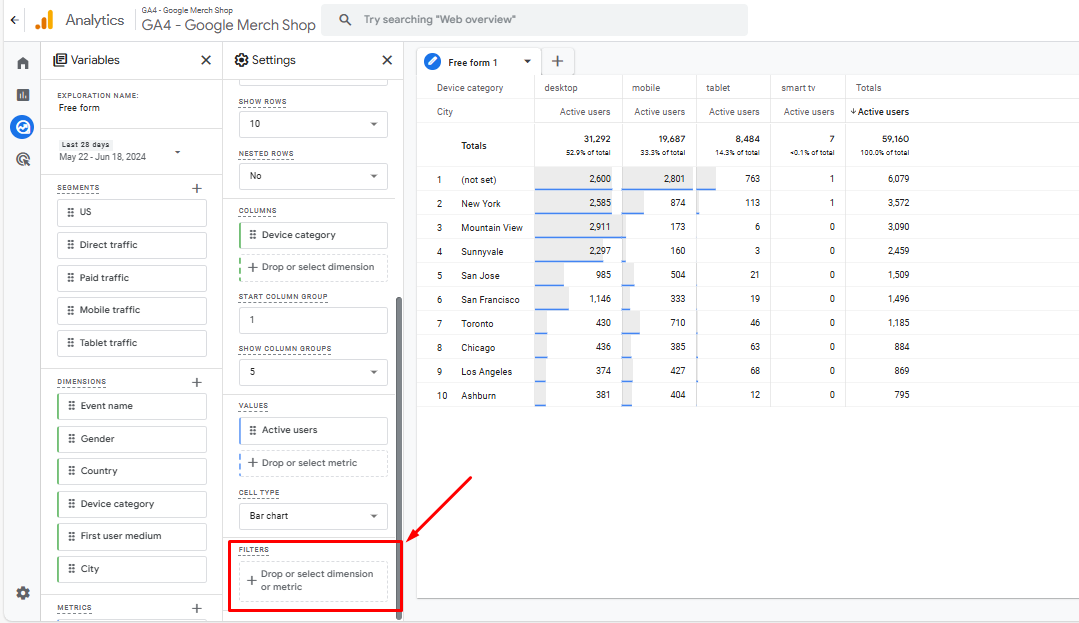
4. Deeply analyze insights with custom reports
Finally, you can take further actions to delve deeper into your insights. For instance, you can filter the data by dragging the dimensions or metrics you want to use as filters.
Best practices to create custom reports in GA4
When creating custom reports in GA4, keep the following considerations in mind to ensure they are effective and provide valuable insights:
Define clear objectives
Before diving into creating a custom report, take a moment to define precisely what you aim to achieve with it. Are you analyzing user behavior, tracking specific events, or assessing the performance of a marketing campaign? Having a well-defined purpose will steer your entire setup process, ensuring that the report is tailored to provide the answers you need.
Choose relevant metrics and dimensions
Select metrics and dimensions that align closely with your objectives. Focus on those that will directly inform your goals to avoid cluttering your report with unnecessary data. Overloading reports with too many metrics and dimensions can lead to confusion and make it difficult to draw meaningful conclusions.
Use segments wisely
Segments are invaluable for drilling down into specific subsets of your data, allowing you to analyze particular user groups or behaviors. When used judiciously, segments can reveal deep insights by comparing different populations or tracking changes over time. However, be cautious not to over-segment your data, as too many segments can make your analysis overly complex and harder to manage.
Regularly review and update reports
The digital landscape and user behaviors are continually evolving, which means your business needs may shift, and your data collection strategies might adapt over time. To keep your custom reports relevant and accurate, regularly review them to ensure they still align with your current goals. Update your reports to reflect any new metrics or changes in user behavior, ensuring they continuously serve your needs effectively.
How to enhance the strength of custom reports in GA4?
Creating custom reports in GA4 opens up a world of possibilities for understanding your website or app’s performance. By customizing the data to meet your specific needs, you can gain deeper insights into your users’ behavior and make more informed decisions that drive your business forward.
As you continue to refine your analytics and reporting, consider how integrated marketing solutions like NestAds can further elevate your business strategy. NestAds offers an all-in-one TikTok ads solution tailored for Shopify stores, providing accurate data tracking and simplified ad management. By leveraging NestAds alongside your GA4 custom reports, you can not only gain a comprehensive understanding of your audience but also optimize your marketing efforts to maximize ROI.
FAQs
What are the key differences between GA4 custom reports and Universal Analytics custom reports?
While both platforms offer custom reporting, GA4 introduces a fundamentally different approach:
- Data model: GA4 operates on an event-based data model that captures all user interactions as events. This is a shift from Universal Analytics’ session-based model, offering a more granular and flexible foundation for custom reporting.
- Exploration reports: GA4 employs “Explorations,” a suite of powerful analysis tools, to create custom reports. This method provides greater flexibility compared to the more rigid, predefined report types found in Universal Analytics.
- Metrics and dimensions: GA4 introduces a different set of metrics and dimensions. While some are directly comparable to those in Universal Analytics, others may require new ways of data analysis.
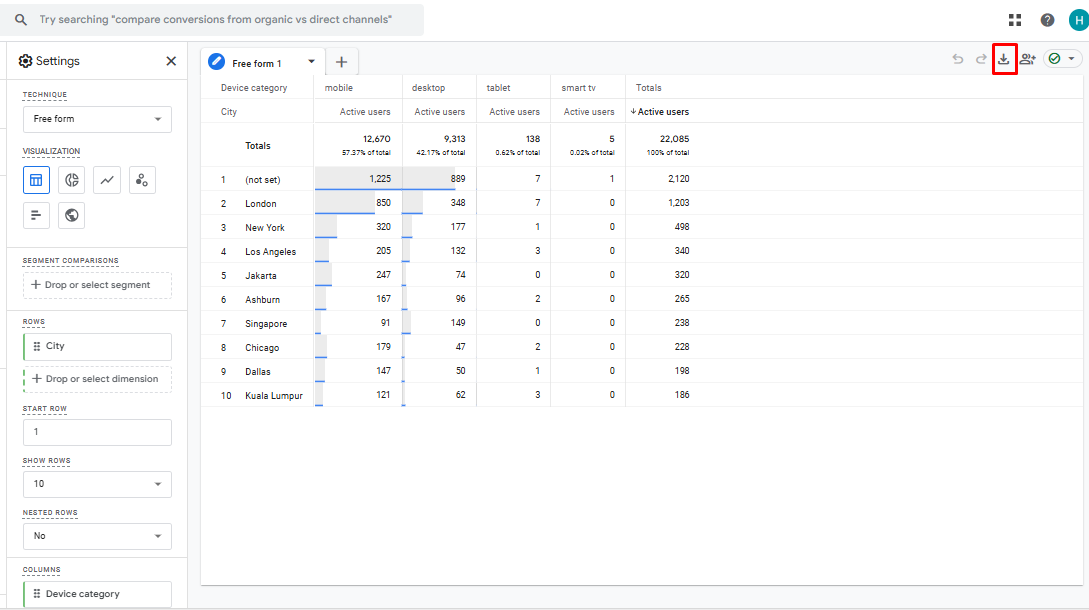
How to download custom reports in GA4?
You can easily download your custom report in GA4. Simply click on the “Export” button located in the top right corner of the screen. You’ll then have the option to select the file format for your export. After choosing, you can save the report directly to your device.
Can I share my custom reports with others?
Yes, GA4 allows you to share your custom reports in several ways:
- Sharing the report link: You can generate a shareable link to your report. This link can be set to allow others to either view or edit the report, depending on your preference.
- Downloading the report: For offline access and sharing, you can download your report in various formats, such as PDF, CSV, or Google Sheets.
These features make GA4 a versatile tool for both creating and sharing detailed custom reports.