

When it comes to evaluating customer experience with a brand, it is vital to drive conclusions based on the metrics. Numbers don’t lie. By measuring eCommerce customer experience, you will have invaluable information about what customers truly think and feel about your brand. From that, it is easier to make business decisions to improve customer satisfaction, reduce churn rate and drive business growth.
In this article, we’ll introduce to you 5 most important eCommerce customer experience metrics that matter to your business. Without further ado, let’s get started now.
Net Promoter Score (NPS)
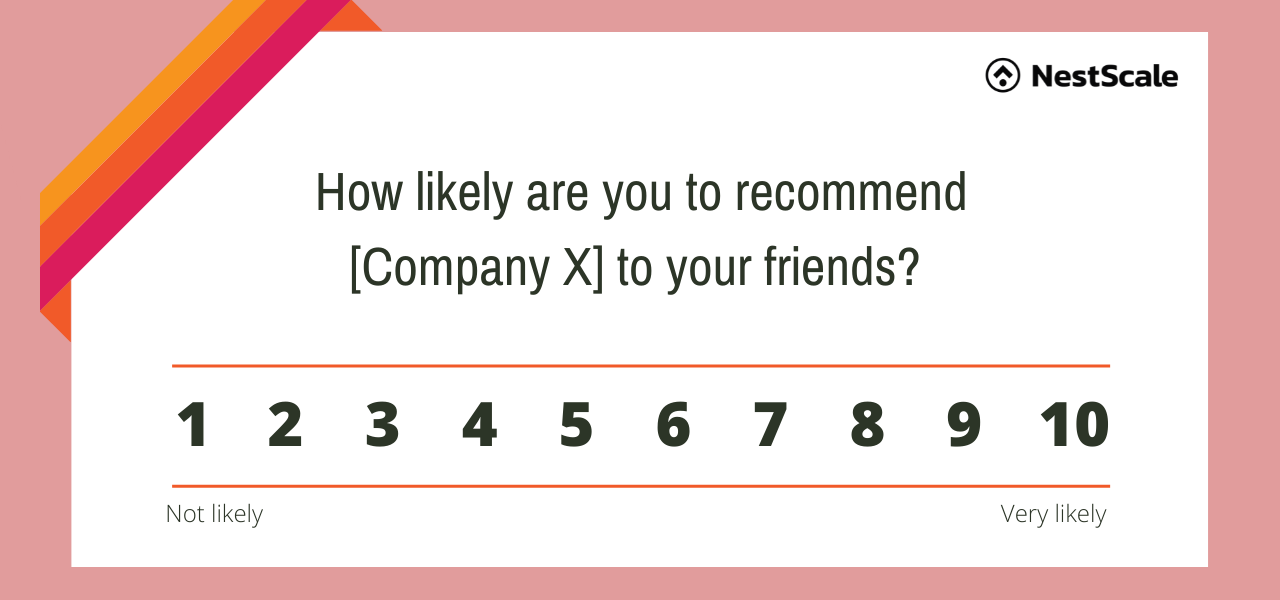
Net Promoter Score is a metric to measure how likely customers recommend your products or services to others. It is often used to weigh customer loyalty to a brand.
Your Net Promoter Score is calculated based on customer responses to an NPS survey. The survey consists of a single-question loyalty measure with a 10-point scale: “How likely are you to recommend [product or brand] to a friend?”
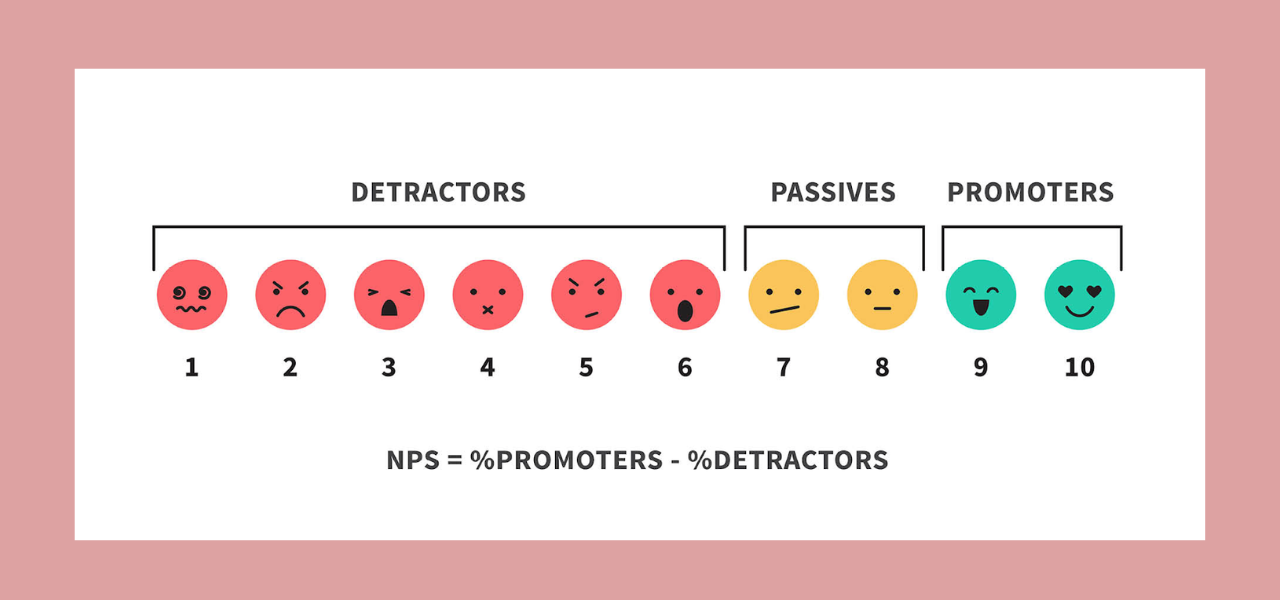
Depending on the NPS score, categorize the responders into 3 relevant groups
- Promoters are customers who rated 9 or 10
Promoters are typically loyal and enthusiastic customers who are willing to recommend your product or service with their friends.
- Passives are customers who rated 7 or 8
Passives are satisfied with your service but not satisfied enough to be considered promoters.
- Detractors are customers who rated between 0 and 6
Detractors are dissatisfied customers who may end the relationship soon and even discourage others from buying from you.
How to calculate Net Promoter Score
To calculate your Net Promoter Score, just subtract the percentage of detractors (responses 0-6) from the percentage of promoters (responses 9-10). Then you will receive the result with a score between -100 and +100.
NPS = % Promoters – % Detractors
If there are 100 responders. If 40% were detractors and only 50% were promoters, your NPS would be 10 (50% – 40% = 10)
Please note that NPS metrics are presented as a number, not a percentage.
What is a GOOD Net Promoter Score (NPS)?
According to the creators of NPS, Bain & Company, here is the evaluation range of NPS score:
- Above 0 is good
- Above 20 is favorable
- Above 50 is excellent
- Above 80 is world-class.
Basically, any score above zero can be considered a “good” score, as it implies that you have more promoters than detractors. 50 and above is excellent, and above 80 is top-notch which is hard to achieve.
The higher your NPS score, the more likely your customer referrals will convert into new leads, resulting in more revenue for your company.
Relevant reading: Top 4 eCommerce Customer Service Best Practices
When should you send an NPS survey?
The best time to send an NPS survey is after customers have a few interactions with your brand. That way, customers will have experienced enough of your product or service and know whether they would recommend you to others.
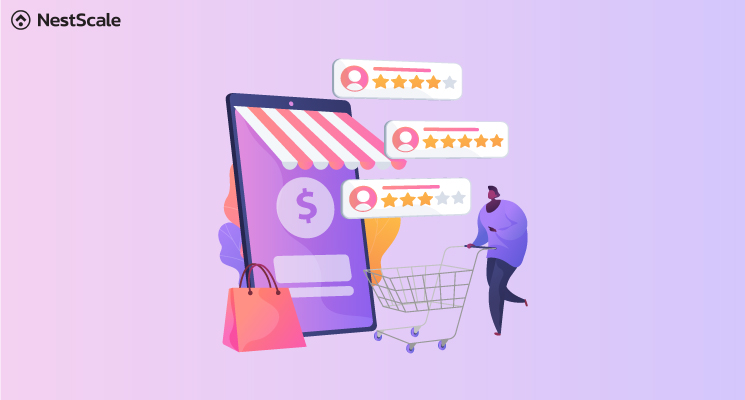
Customer satisfaction score (CSAT)
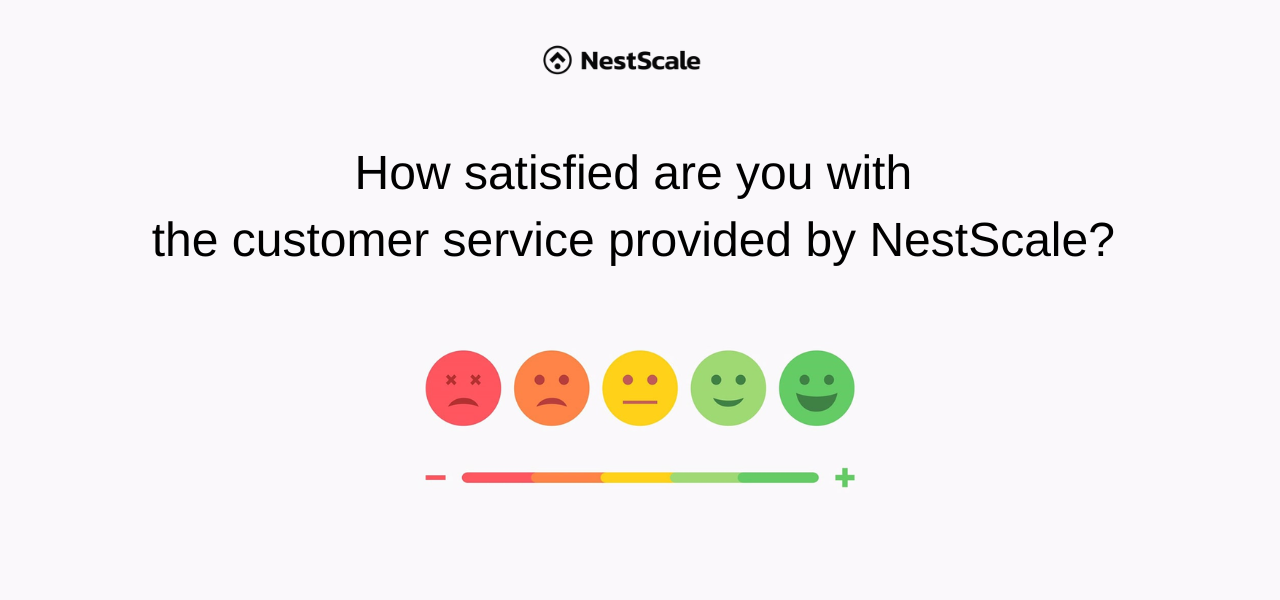
Customer satisfaction score (CSAT) is one of the most important metrics to track how customers feel satisfied or unsatisfied with a recent interaction or experience with your brand.
With CSAT, you better understand whether you meet customer’s expectations or not, and know pain points or bottlenecks in the customer journey. From that, you can improve your product or service to enhance customer experience and loyalty.
To design your CSAT survey, just start by deciding what question you want to ask customers. Common CSAT questions
- How satisfied are you with the product/ service you received?
- Did you find everything you expected?
- How would you rate our customer service quality?
Respondents use the following 1 to 5 scale:
1. Very unsatisfied
2. Unsatisfied
3. Neutral
4. Satisfied
5. Very satisfied
The second part of the CSAT survey is often an open-ended form, where customers can explain why they chose the rating in their own words. Or else, you can ask a question to encourage customers to share their demand and to suggest what you can do to improve customer experience.
How to calculate CSAT
The CSAT score will range from 0-100. To calculate your CSAT score, divide the number of “satisfied” responses you receive by the total number of responses. After that, you multiply it by 100 to get a percentage.
*Number of satisfied customers = the number of survey respondents who chose a score of 4 (satisfied) or 5 (very satisfied).
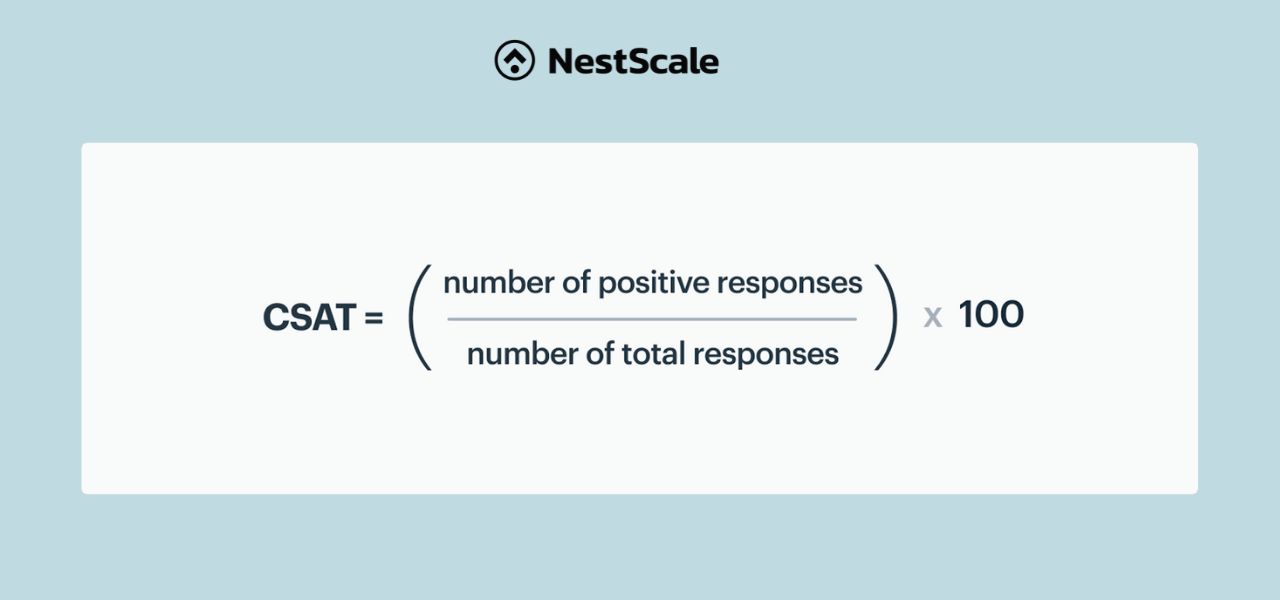
For example, if you received 25 total responses and 15 of them were satisfied— your CSAT score would be 60% (15 positive responses / 25 total responses = .60 x 100 = 60%).
What is a GOOD CSAT?
While CSAT scores vary by industry, a good score will typically fall between 75% and 85%. Because CSAT only focuses on your promoter scores, achieving a near-perfect score is difficult.
When should you send the CSAT survey?
CSAT targets a “here and now” reaction of customers to a specific interaction. Therefore, you should send the CSAT survey right after customers have experience with your brand.
For example, after a sales transaction, user onboarding, or support interactions, ask for CSAT feedback immediately. For product feedback, you can schedule a reasonable time to deliver a survey so that customers have enough time to fully experience your product.
Regarding the method to deliver a CSAT survey, you can include it in the email signature, send the survey via automated email, SMS or in-app pop-ups.
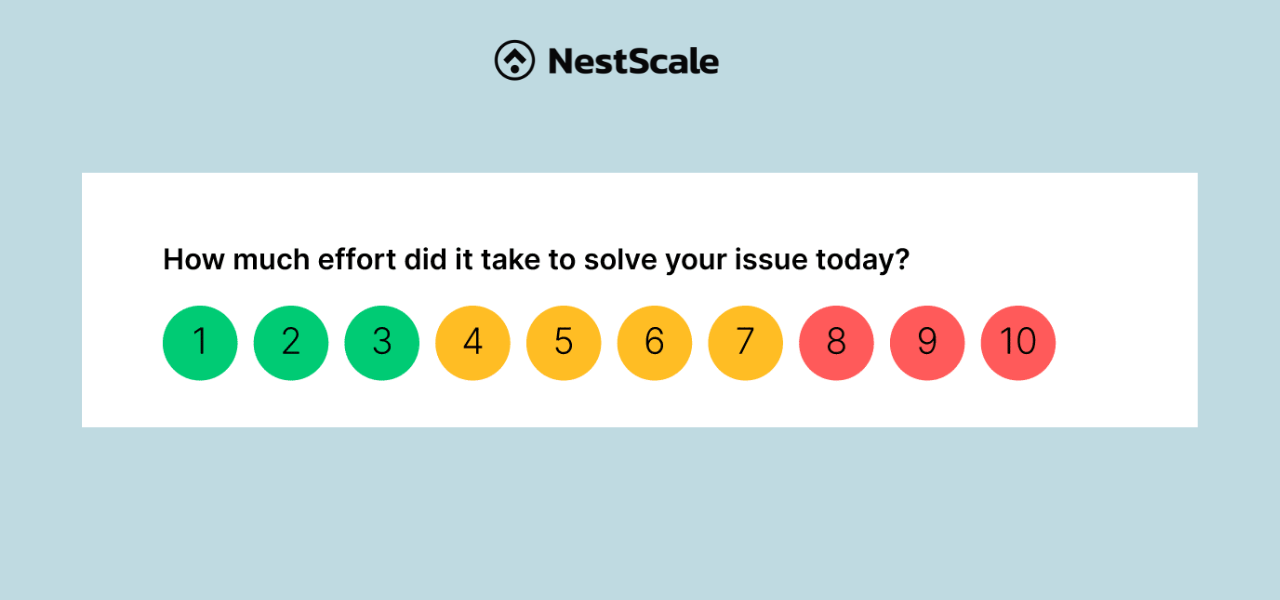
Customer effort score (CES)
Customer effort score is an indicator to measure how easy it is for customers to interact with your business to get a specific goal. The goal might be solving an issue with customer support, making a purchase, signing up for newsletters, and so on.
In the CES survey, there is typically a question, “on a scale of ‘very easy’ to ‘very difficult’, how easy was it to interact with [company name].”
CES helps your business improve the most painful parts of the customer journey, making their overall experience better. As a result, a better customer experience leads to more loyal long-term customers, which improves your company’s bottom line.
How to calculate Customer Effort Score
This is generally done with the 1-10 Customer Effort Score scale. To calculate CES, you just take the total sum of your CES scores and divide it by the number of responses you got.
Customer Effort Score = Sum of all Customer Effort Scores ÷ Total amount of respondents.
For instance, if you get 12 responses: 3, 7, 5, 3, 7, 7, 6, 5, 7,7, 7, 7. Then your CES score will be (3+7+5+3+7+7+6+5+7+7+7+7) ÷ (12) = 5.9 (Out of 10)
If you’re using other metrics (like Happy/Unhappy faces), you need to assign a number to each emotion for your internal analysis.
What is a GOOD CES score?
Because businesses frequently use different units to measure responses, there is no universal standard for a good CES. Some use a 1-5 scale, others a 1-7 scale, and still others use happy and sad faces instead of numbers.
If you set the highest point equal to the lowest effort, it means the higher the CES, the better. A high CES score indicates that your company provides a smooth experience for customers, whereas a low CES reveals that people find your processes difficult or your customer service not helpful.
When should you send the CES survey?
Right after customer interaction that led to a purchase
Sending a CES survey to a customer after they’ve engaged with your company and made a purchase is a terrific method to get fast feedback on how much effort they went in to make their purchase right away.
Right after customer service touchpoint
Sending a CES survey just after a customer service touchpoint (such as email support tickets) enables you to quickly evaluate how efficient your support team is. In addition, you can send a survey after a customer has finished reading a Knowledge Base article to measure how useful your content is.
Customer retention rate
Customer retention rate (CRR) is used to measure the number of customers a company retains over a given period of time.
The fact is that retaining customers is easier and less expensive than acquiring new ones. With the customer retention rate, you can determine whether or not your brand has satisfied existing customers. Knowing your customer retention rate is also important for reducing churn and increasing loyalty. It allows you to better understand what keeps customers coming back to your company and can also alert you to opportunities to improve the customer experience.
How to calculate customer retention rate
To calculate customer retention rate, you need to collect 3 kinds of statistics
- The number of your customers at the beginning of a given period
- The number of your customers at the end of that period
- The number of new customers you get during that period
The following formula is used to calculate the customer retention rate.
CRR = [(Customers at end of period – New customers during this period) / Total customers at the start of the period] x 100
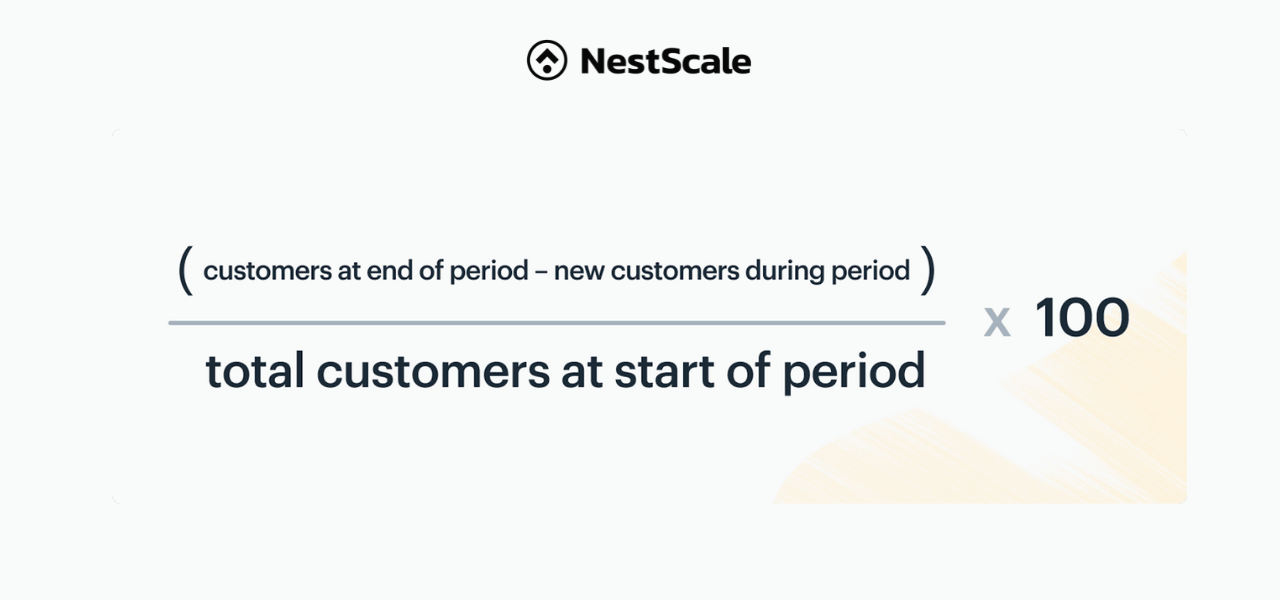
For example: At the beginning of June, you have 20 customers, gain 5 new customers during that month, and have 24 customers at the end of June.
CRR = [ (24 – 5) / 20 ) ] x 100 = 95% retention
What is a good Customer Retention Rate?
Customer retention rate varies by industry. The average customer retention rate in retail is around 63%, 75% in banking, and 81% in IT services.
According to Bain & Company’s Frederick Reichheld’s research, a 5% increase in customer retention increases profits by 25% to 95%. As a result, even a small increase in your retention rate over time can significantly increase your revenue
Customer Lifetime Value
Customer lifetime value (CLV) refers to the total revenue a company can expect to earn over the lifetime of a given customer relationship.
CLV helps you easily develop strategies to acquire new customers and retain current ones at your business while maintaining profit margins. It is also useful for making business decisions. For example, you can use customer lifetime value to identify and target the most valuable customer segments to the company.
How to calculate Customer Lifetime Value
To calculate your average customer lifetime value, you need to identify 3 kinds of statistics including Annual revenue per customer, Customer relationship in years and Customer acquisition cost (CAC).
Below is the Customer lifetime value equation.
Customer Lifetime Value = (Annual revenue per customer * Customer relationship in years) – Customer acquisition costs
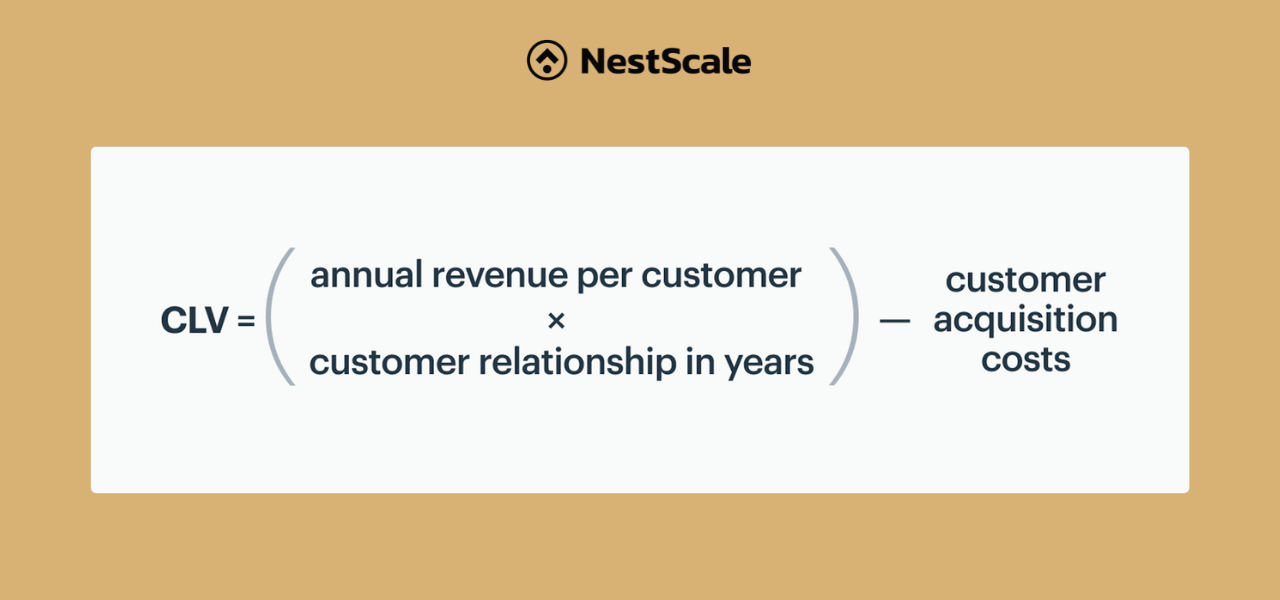
Here’s an example of how to calculate customer lifetime value.
- Annual revenue get from Tom = $500
- Customer relationship duration = 3 years
- Acquisition cost = $50
CLV = $500 x 3 – $50 = $1,450
What is a good CLV?
A good Customer Lifetime Value should be at least three times greater than the acquisition cost (CAC).
If you spend $100 on marketing to get a new customer, that customer should have a lifetime value of at least $300. If it is not in the 3:1 range, your profit margin will be insufficient to scale your business.
Take your next steps
Now you know 5 important eCommerce customer metrics that are integral to the success of a business. Metrics alone won’t satisfy customers and build customer loyalty. It’s on you to take this data and build a unique customer service experience that works for your brand.
Get started with customer service software that enables you to both improve customer experience and measure key metrics at ease. With NestDesk, you can centralize all customer messages from multiple channels and close more sales right from one dashboard. The intuitive analytics report lets you know how satisfied customers are with your customer service, revenue generated from support and most importantly, valuable customer insights.
FAQs: eCommerce Customer Experience Metrics
The most important eCommerce CX metrics are:
– Customer satisfaction (CSAT)
– Net Promoter Score (NPS)
– Repeat purchase rate
These metrics show how easily customers can shop, how satisfied they are, and how likely they are to return.
You can improve eCommerce CX by making shopping simpler and more personalized. Focus clean website navigation, responsive customer support, and seamless checkout.
Yes, AI-powered tools such as AI chatbots significantly improve customer experience by providing faster, more personalized interactions. AI can automate support 24/7 and deliver real-time assistance, leading to higher customer satisfaction and better conversion rates.