Social media has been significantly developing all over the world. It is not only the place businesses place their brand marketing ads but also is a critical social media service channel customers connect with brands.
When a business delivers up-to-date social customer service, all most customers will feel satisfied and want to stick with the business for a long time. However, knowing where your customer service offers the right customer and how social customer service quality can be measured are extremely intricate.
In this blog, we provide you with the most important social media customer service metrics. Those metrics would help you answer how effective your social customer service strategy is and what you can do to improve customer experience on your social media platforms.
What are Social Media Customer Metrics?
Social media customer metrics are offering support through social media like Facebook, Twitter, Instagram, etc. It enables you to determine how effectively your team addresses customer requests and how many people view your entire piece of content.
By selecting the critical social media customer metrics, you can assess performance, focus on customer issues, guide you through resource allocation planning, and pinpoint necessary system improvements.
4 Most Important Social Media Metrics to Track
Time Responding
First Response Time
The first response time measures the effectiveness of your social team by indicating how long your social customers must wait in the queue for a response.
The response time reflects customer satisfaction as well. The brief response will assist you in making a favorable first impression.
To determine how long it takes your social customer service department to respond, calculate their first response time (FRT). The formula for the first-time response is:
Average First Response Time = Sum of First Response Times/ Number of Responses
Average Response Time
The average response time indicates how long it takes the social media customer support service to respond to questions.
It is calculated by dividing the total time taken to respond within a specific time frame by the number of responses received during that time period.
The average response time can be calculated on an hourly, daily, weekly, monthly, or annual basis. Determining the average response time can help customers optimize their operations for support requests significantly.
Mean Time to Resolution
This social media customer metric shows the time the solution is addressed. It is the time since the ticket came in until closed.
Long resolution times have a direct impact on customer satisfaction. So, in order to be well-prepared for this, you should know where the productivity is and what measures you can take to speed up the solution-solving process. You must ensure that your team provides prompt and solution-oriented service to social customers.
The Efficiency in Addressing Queries
Average Handling Time (AHT)
The average handle time (AHT) is the amount of time a social media agent spends on an open ticket.
To calculate this metric, add all resolution times and divide by the number of resolved issues.
The shorter the resulting AHT, the better, because it allows your agents to deal with more customer issues on social media. The formula for this metric is:
Average Handling Time = (Total talk time + Total Waiting Time + After Talk Work Time)/Total Number of Resolved Issues
If your social team has a high average handle time, it means that your team is having trouble understanding customer requests or that the agent is not asking the right question. However, AHT can be high in some cases because agents must deal with more complex customer issues.
Issue Resolution Rate
The issue resolution rate is an important social media customer service metric that you need to measure closely. This represents the percentage of issues that your team actually resolves in the total of social customer queries.
The ideal issue resolution rate would be 100%. However, you cannot always deal with all customer requests. These unresolved issues are the vital thing you need to look at closely. If you are not able to address these unresolved tickets, let your customers know gently and find another alternative for these.
Rate of Answer Calls
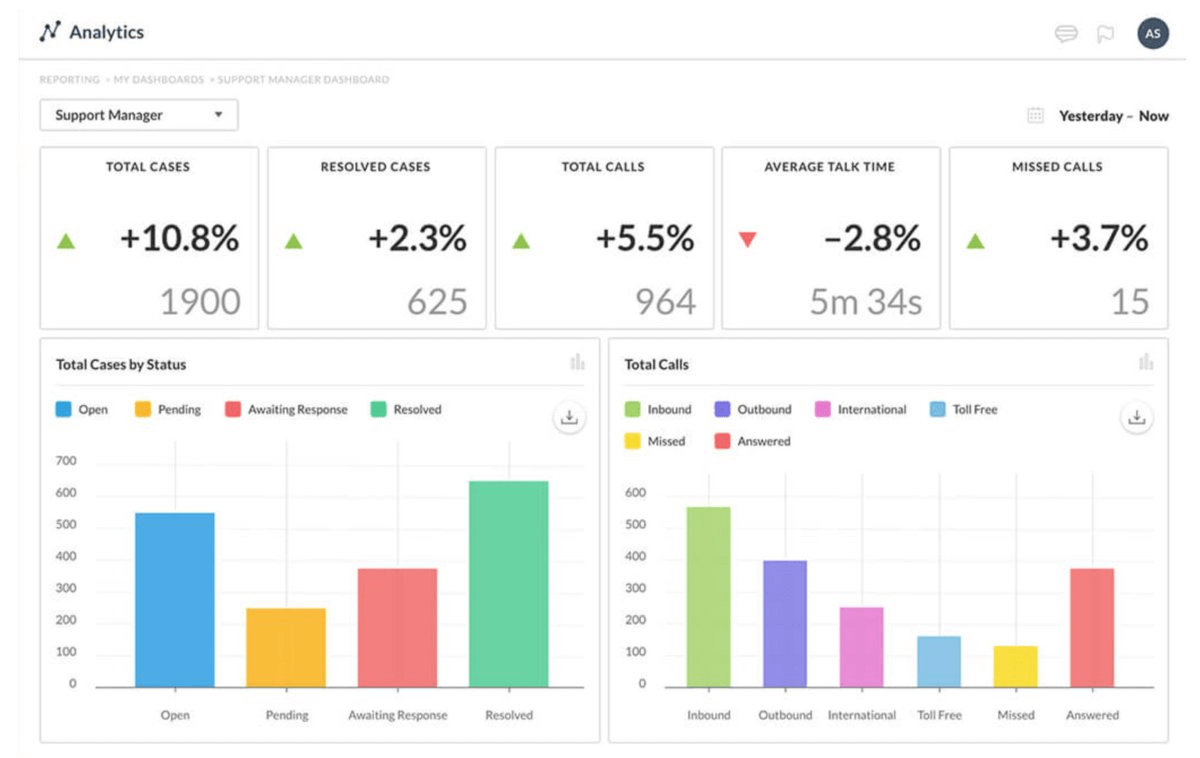
The rate of answer calls is another social media customer metric that helps to measure your team’s efficiency in addressing social customer requests. It indicates the number of calls answered in comparison with the number of calls received by your social customer support team.
The business with a higher rate of answering calls will be able to solve more social customer requests than those with a lower rate.
To calculate this metric, divide the number of answered calls by the total number of calls
Measure Your Performance
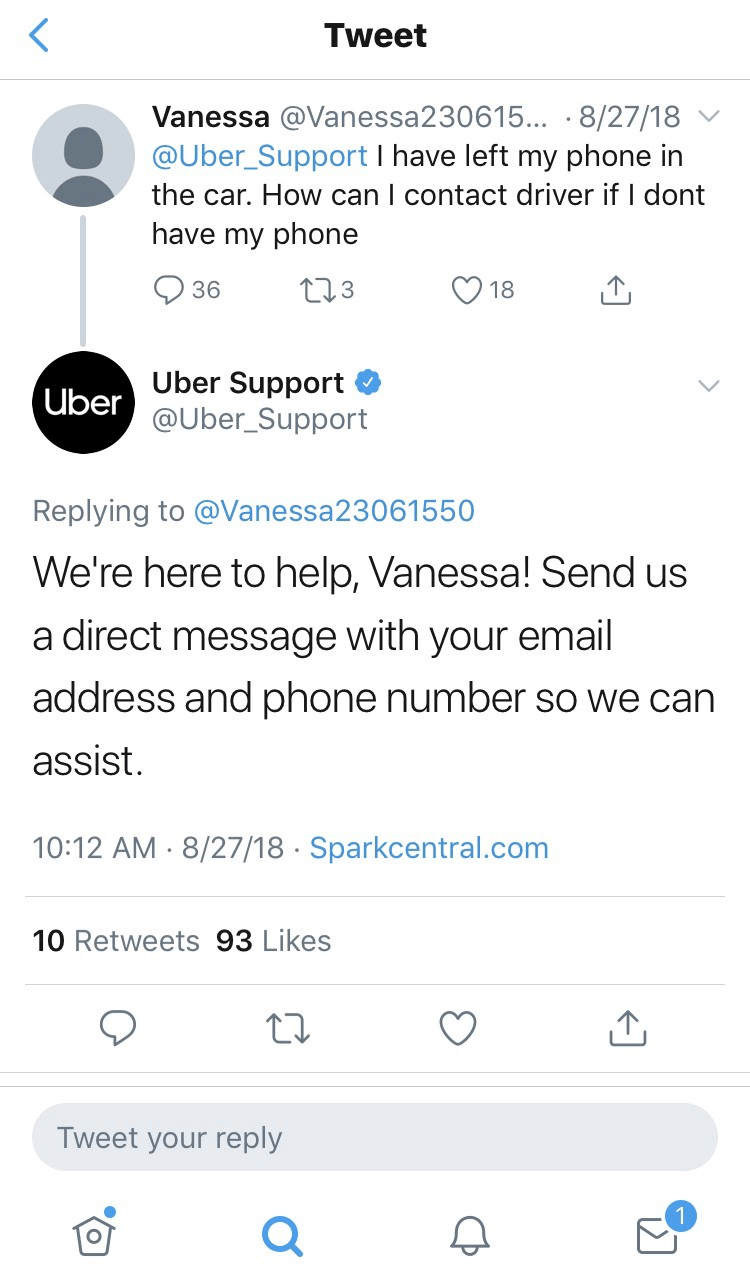
Like, Share and Retweet
Your social media customer service is partly reflected by the number of likes, shares, and engagement from customers. If your team is doing well, customer experience would be improved and gain more customer action.
The more likes, the more positive reach into new audiences. So, these social engagement metrics are essential for measuring.
Sales
Sales is the process of making money by selling goods or services. It is critical to distinguish between sales and revenue because businesses have additional income sources such as interest, money from litigation, royalties, and other fees.
This allows you to effectively monitor your business’s growth and have some fine-tuning to your customer support to make more progress. The sales formula is as follows:
Sales = Price of each product or service x Number of units / Services sold
Improve Customer Satisfaction
Customer Care
Focusing on the customer experience is a vital process in social media customer support. With this metric, you’ll know about your customer’s experience with your brand, your own performance, and who’s watching your social media platforms.
Customer care is quite similar to the response rate. They track how fast your team responds to each customer request.
Net Promoter Score (NPS)
This metric illustrates the percentage of your customers who refer a brand, a product, or a service to their peers based on the experience on your social media customer service.
Businesses need to set a few questions for customers to ask them for any recommendations about your social customer services. By doing this, you’ll have more perspective on the promotion of your customer success.
The score which is calculated from customers’ answers is considered a predictor of customer loyalty and profitability.
Customer Experience Rating
Almost all customers intend to spend more money on the business with superior customer service. Customers will trust and believe in their experience rather than the advertisements or your claims about your products.
Customer experiences are small things like empathy statements you use, the eagerness of resolving their problems, or the tone of your staff.
This key social media customer service metric is considered as an ultimate impact on your customer retention. You can measure this by using a combination of transactional surveys and in-person feedback.
Customer Satisfaction
Measuring customer happiness is more difficult than calculating sales figures.
There is no certain method of measuring the satisfaction of your customers, but you can do something to determine how happy they are with your social customer service.
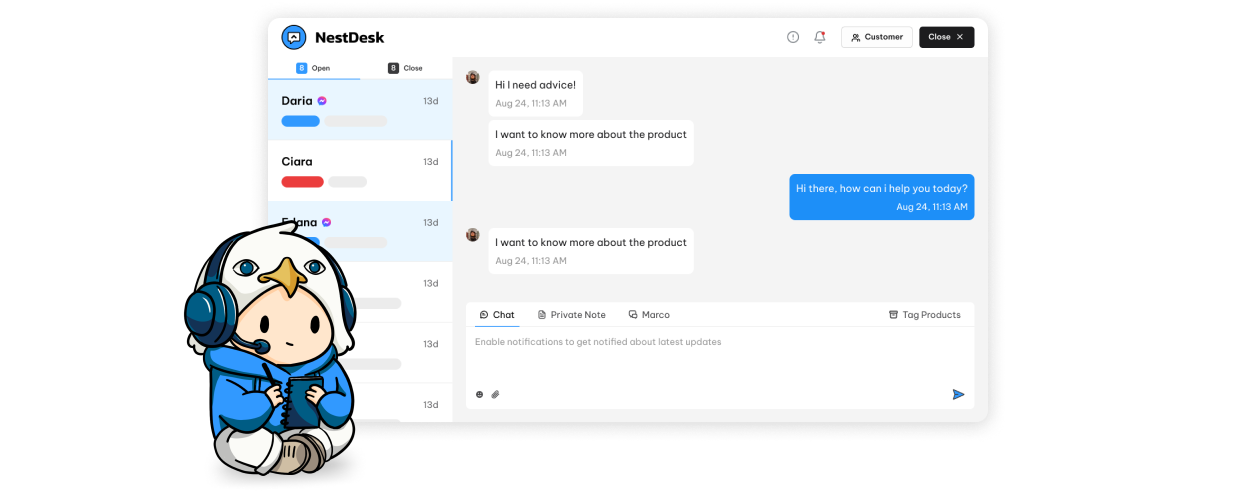
Setting up workflows to collect customers’ feedback. By looking at feedback, you can understand their feeling and satisfaction level with products on your social media platforms. If you connect with customers by customers-chatting apps like NestDesk, let’s use a post-chat survey.
Collecting data over a long period also helps to create a more accurate picture of how your team is doing.
Takeaway
You cannot always satisfy your customers if you do not have general knowledge about your current work. By calculating those customer service metrics above, you can improve your sales figures, and enhance customer experience and high customer retention on your social media platforms.
With NestDesk, you can save time and answer directly customer requests with integrated software for business growth. Through the Facebook messenger feature on NestDesk, you are able to chat with customers directly, centralize all conversations and generate sales within one inbox.


