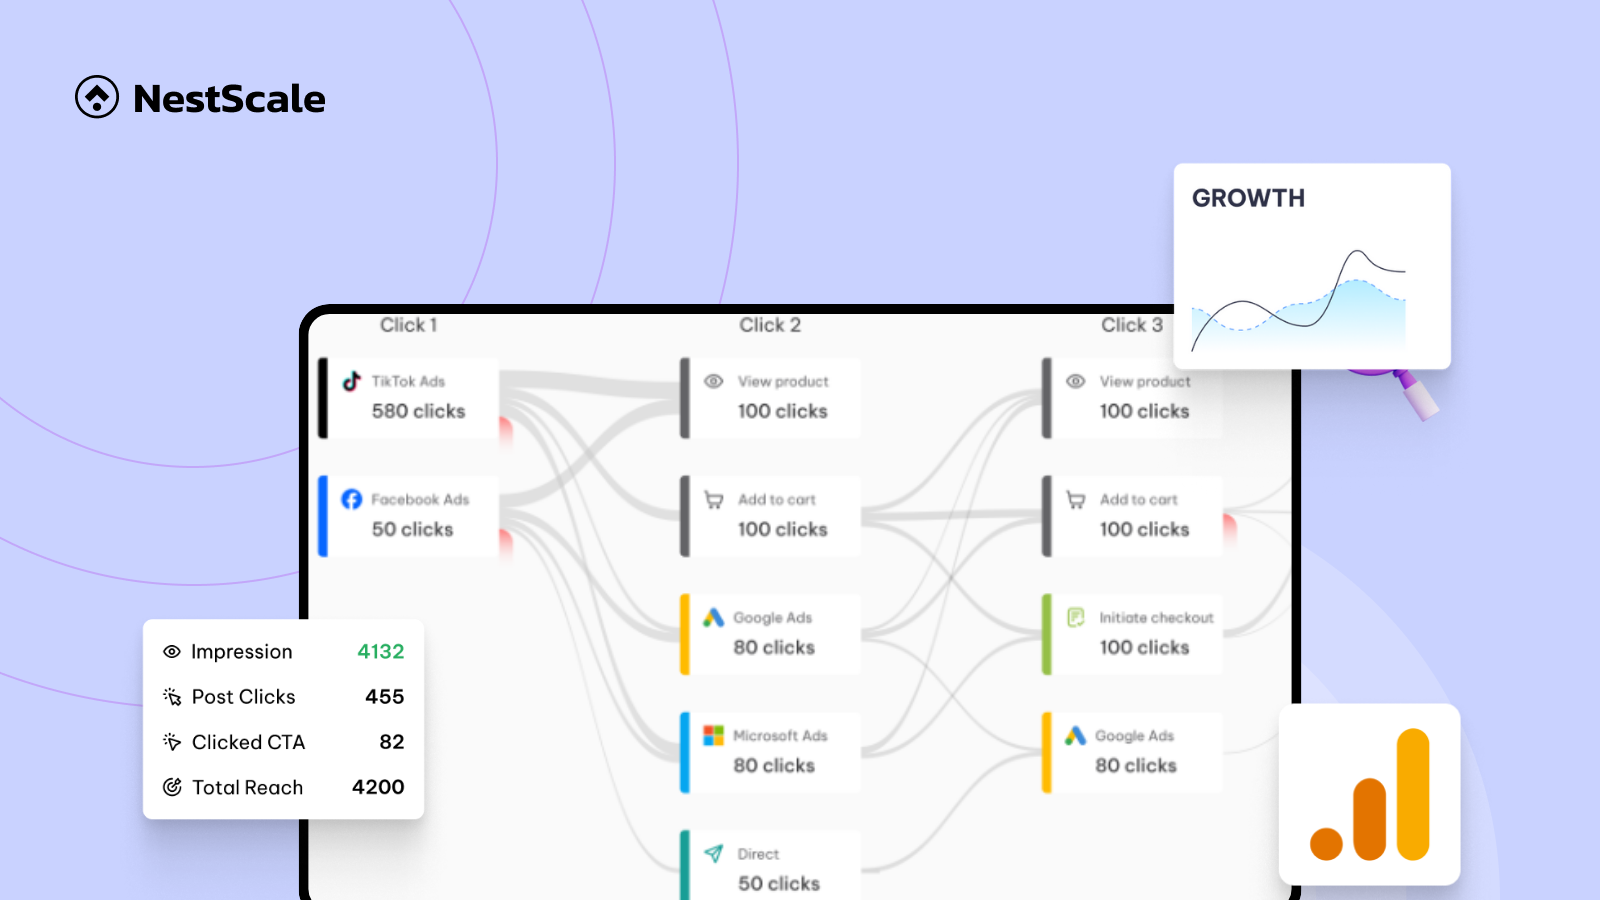
What leads your customer from the first click to the final purchase? They might see an Instagram ad, search for your brand on Google, and respond to a personalized email. However, it’s not always straightforward. Each of these steps plays a critical role in their decision-making. To truly maximize your ad budget, it’s essential to understand the complete customer journey. That’s where customer journey metrics come into play, helping you see what’s working to make the most out of every dollar ad spent.
In this blog, we’ll explore customer journey metrics, discuss how to track them and discuss their importance in creating truly resonated ad strategies.
Why customer journey metrics matter
Customer journey metrics track every step a customer takes with your brand, from the first interaction to the final purchase. By understanding how they engage along the way, you can figure out which channels and messages are hitting the mark, allowing you to fine-tune your approach. Here’s why these metrics are so important:
- Enhanced understanding of customer behavior: You’ll know which channels make the biggest impact at each stage of the journey.
- Optimized ad spend: You can focus your budget on the channels and tactics that drive conversions.
- Improved ROI: Use the data to refine your strategy and improve your return on investment.
7 metrics to track during your customer journey
Customer journey metrics are crucial for getting the most out of your ad strategy. They give you valuable insights into how your campaigns are performing and help you make data-driven decisions to improve your overall marketing approach.
Awareness and Engagement stage metric
At the top of the funnel, your goal is to attract attention, increase awareness, and build interest. Metrics here focus on how well you are capturing and engaging potential customers
Return on ad spend (ROAS)
ROAS is a key performance metric that measures the revenue generated for every dollar spent on advertising. It provides insight into how effectively your ad spend translates into revenue.
Tracking ROAS across different channels allows businesses to understand which platforms yield the highest returns on their investment.
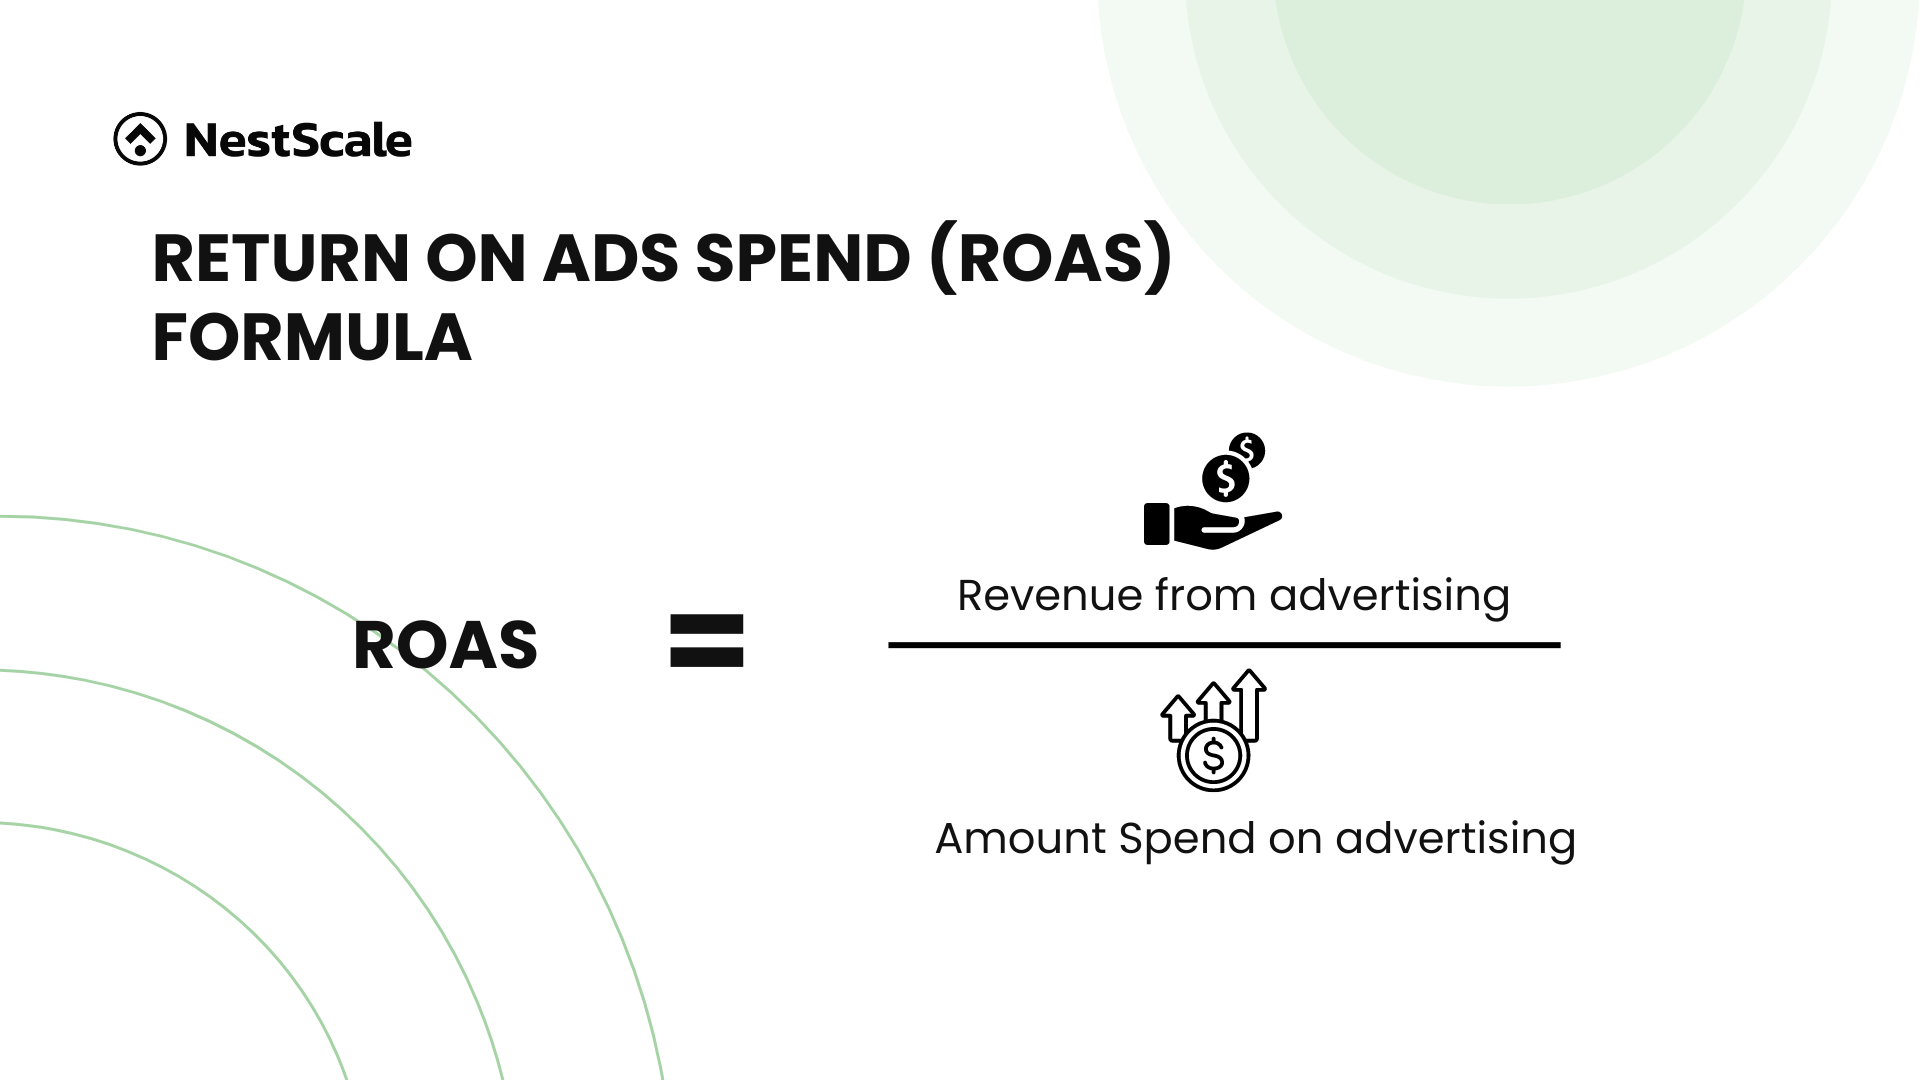
For instance, if Facebook ads show a higher ROAS than Google ads, you might allocate more budget to Facebook. This metric helps focus spending on profitable channels, reducing wasted budget on less effective platforms and supporting data-driven decisions to boost overall revenue.
Bounce rate
Bounce rate refers to the percentage of visitors who leave your website after viewing only one page. It’s a key indicator of how engaging and relevant your landing page or ad content is to the visitors
When a visitor lands on your site, if they view a single page and leave without navigating to other pages, it counts as a “bounce.” This metric is useful for evaluating your landing pages’ effectiveness and whether they capture the visitor’s attention.
Impressions and reach
Measuring how many people see your ads (impressions) and how many are exposed to your brand (reach) helps assess the effectiveness of your awareness campaigns.
Impressions give you an idea of how often your content is being displayed, while reach helps you measure how many unique users have been exposed to it. These metrics are both crucial for evaluating the overall visibility and scale of your campaigns
Conversion & Purchase stage metrics
At the end stage of your customer journey, you want to focus on driving conversions—getting the customer to take action and purchase. The metrics in this stage are more focused on evaluating how well your ads are converting leads into paying customers.
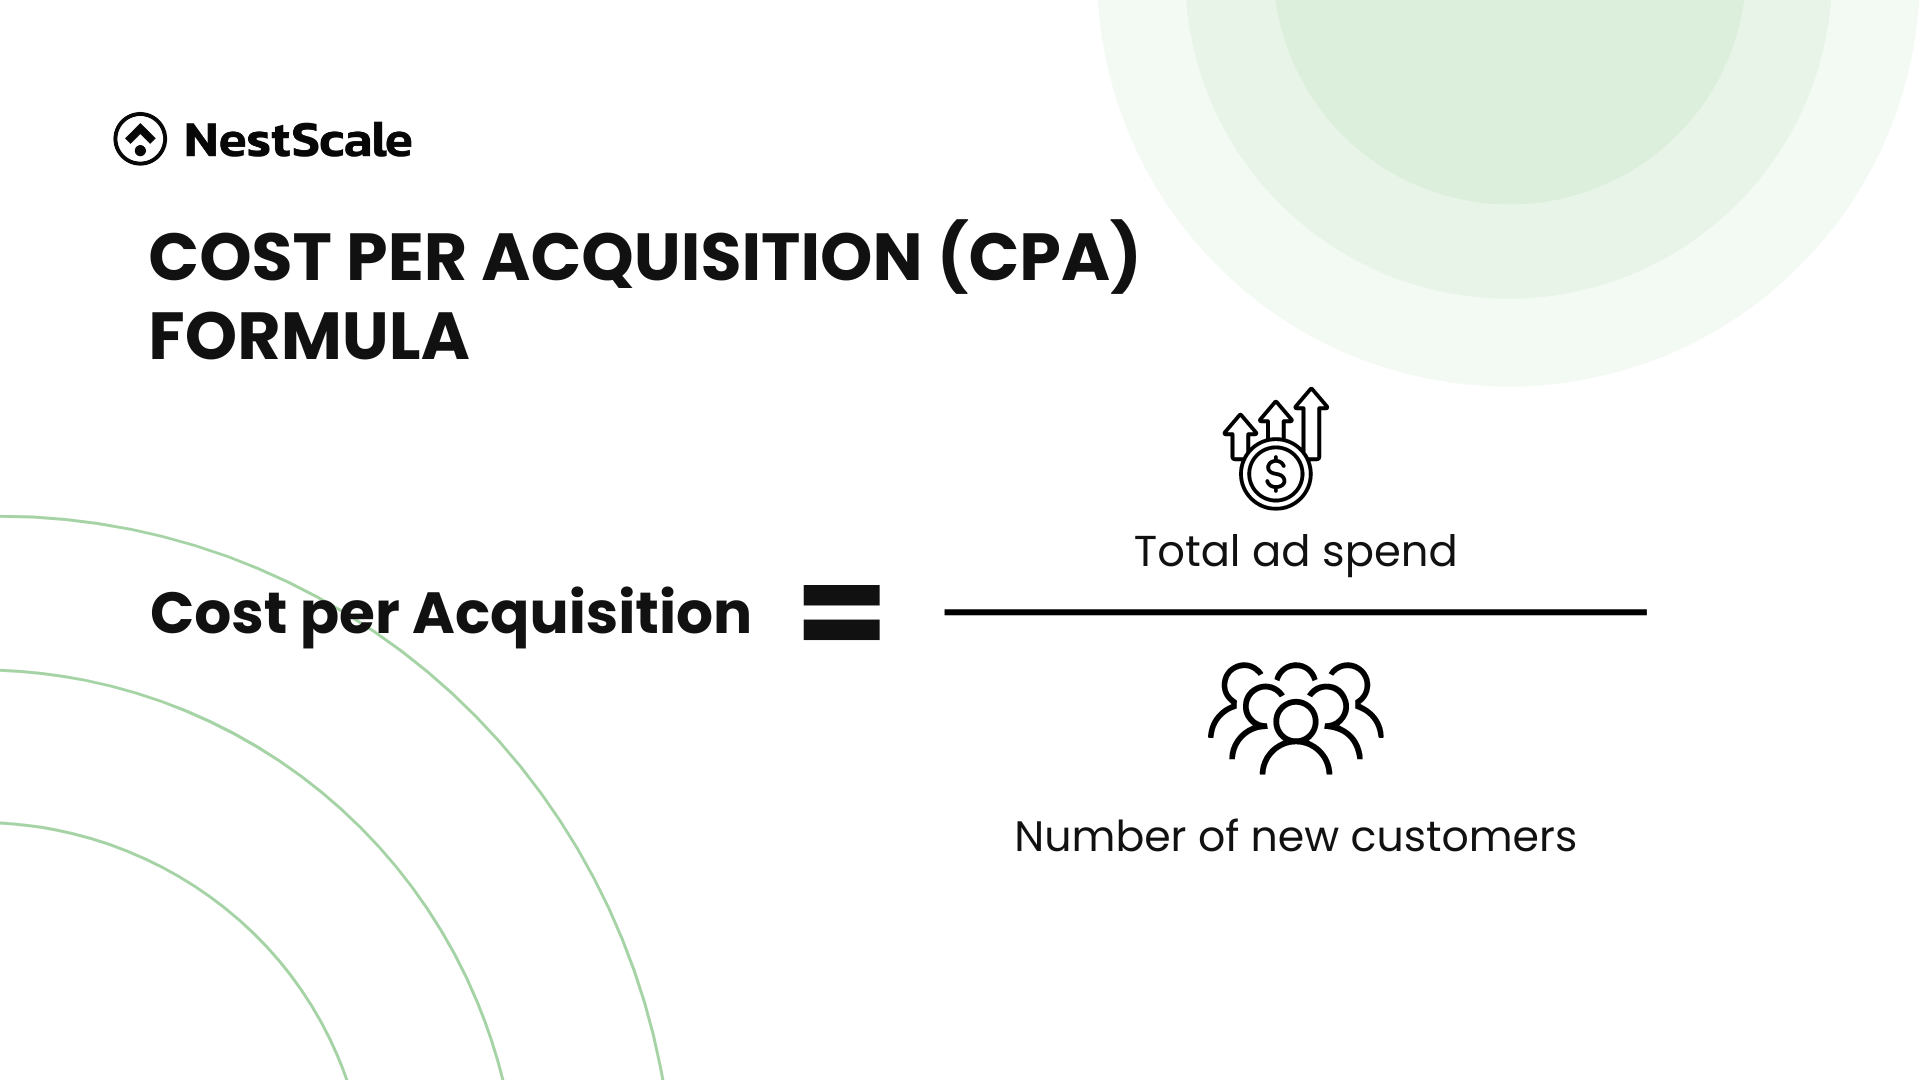
Cost per acquisition (CPA)
Conversion rate is the percentage of users who take a desired action after clicking on an ad, such as making a purchase, signing up for a newsletter, or adding an item to their cart. When broken down by channel, it indicates how well each platform contributes to conversions.
Knowing your conversion rate by channel is essential for identifying which platforms resonate most with your audience. For instance, you might find that Instagram has a higher conversion rate than Twitter. This suggests that you might want to spend more on this channel, as Instagram audiences are more likely to make a purchase.
Conversion rate by channel
Conversion rate is the percentage of users who take a desired action after clicking on an ad, such as making a purchase, signing up for a newsletter, or adding an item to their cart. When broken down by channel, it indicates how well each platform contributes to conversions.
Knowing your conversion rate by channel is essential for identifying which platforms resonate most with your audience. For instance, you might find that Instagram has a higher conversion rate than Twitter, suggesting that Instagram audiences are more likely to make a purchase.
Customer lifetime value (CLV)
CLV (Customer Lifetime Value) gives you an estimate of how much revenue a customer will generate for your business over their entire relationship with you. It takes into account their past purchases and what they’re likely to spend in the future, giving you a clearer picture of their long-term value.
This metric is super useful for figuring out which channels bring in high-value customers—those who will keep coming back and stay loyal to your brand. By looking at CLV, you can focus your marketing on attracting customers who are likely to stick around, helping you build a strategy that drives steady, long-term growth.
Shopping cart abandonment rate
The shopping cart abandonment rate measures the percentage of customers who add products to their cart but leave the site without completing the purchase. It helps you identify barriers in the checkout process.
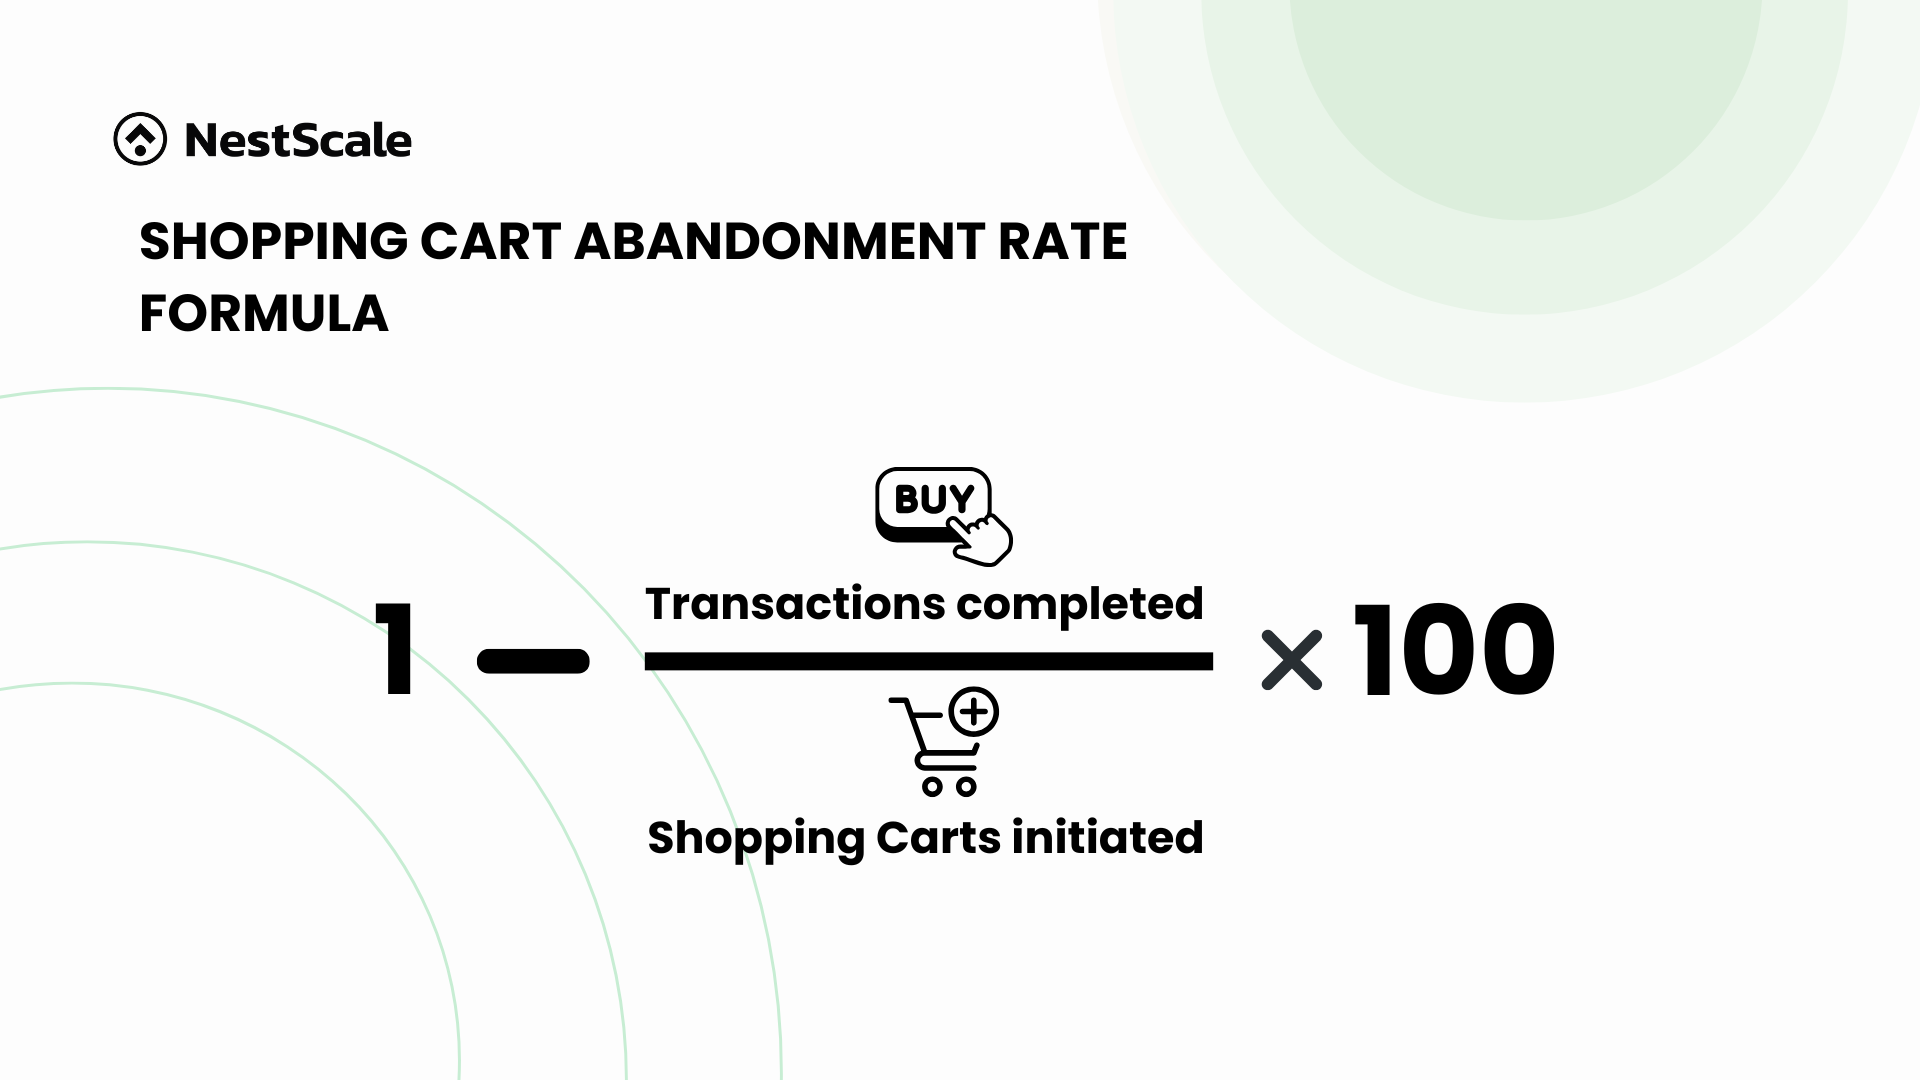
A high abandonment rate often points to friction points in the checkout, like complicated forms, lack of payment options, or unexpected costs.
If customers frequently abandon their carts after seeing high shipping fees, you can use this data to either offer free shipping or clearly display costs earlier in the checkout process to reduce abandonment and improve conversions.
How to leverage customer journey metrics to enhance performance
Once you identify key metrics, applying them to your ad strategies can significantly boost performance. These metrics help you see where your marketing efforts excel and where adjustments are needed. By leveraging customer journey insights, you can make informed decisions that enhance engagement and drive higher conversions and revenue.
Prioritize high-performing channels and ad creatives
Use ROAS and CPA metrics to identify the channels that deliver the highest returns and focus your budget there. For instance, if TikTok ads show lower CPA with high engagement, consider allocating more budget to this platform.
Additionally, leverage engagement metrics to refine your ad creatives—incorporate elements from high-performing visuals across other channels to maximize engagement and drive conversions.
Optimize attribution models for accurate insights
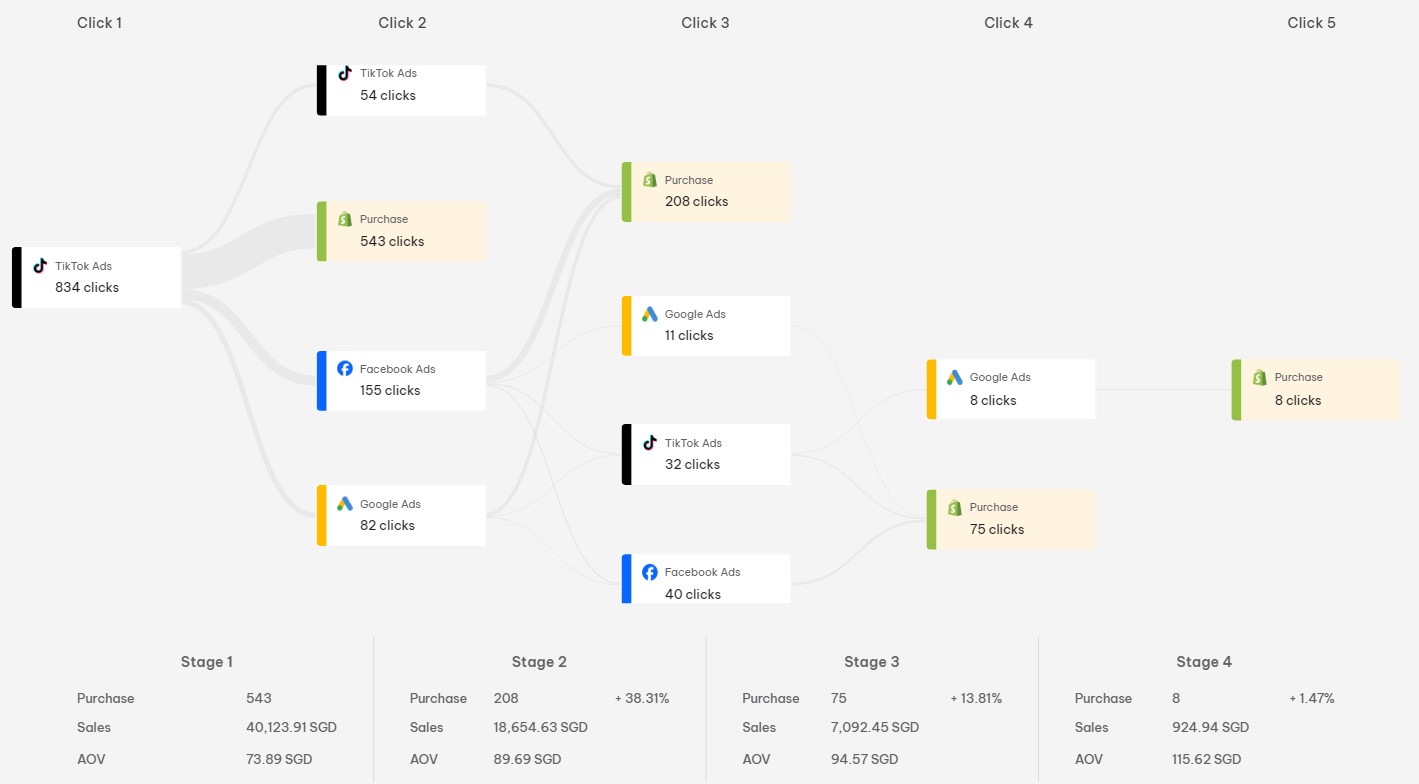
Play around with different attribution models, like first-touch, last-touch, or time decay, to find the one that best matches how your customers behave. Changing your attribution model can give you a clearer idea of which channels are truly driving conversions, so you can fine-tune your strategy with insights that really reflect what your customers are doing
Build cohesive, retention-focused campaigns
Look at customer journey data to create smooth, cross-channel campaigns that help build brand familiarity. For example, if social media ads lead to more conversions through search, create integrated campaigns that connect both channels.
Use CLV data to focus on retention strategies for high-value customers, helping you build a loyal customer base that brings in steady, long-term revenue.
Fine-tune audience segmentation based on behavior
Customer journey metrics can show you which customer segments are the most profitable and how they interact with different channels. Use this data to create more specific audience segments.
For example, if certain customers convert better through Google, target them with content that’s highly relevant to their needs. Meanwhile, focus your social ads on engaging other groups who might respond differently.
Create data-informed ad testing plans
Metrics like engagement and CPA provide valuable insights into ad performance. Use these to design A/B tests that are rooted in real customer data. Testing different ad creatives, formats, or call-to-action buttons based on data can lead to quicker improvements in ad performance.
Use step-by-step messaging to guide the customer journey
Understanding the customer journey lets you create a seamless experience across channels with step-by-step messaging. For example, start by introducing your brand with awareness ads on Facebook, then retarget on Instagram, and finally encourage a sale with personalized offers via email.
This way, each ad becomes a thoughtful step in guiding the customer, instead of just a one-off interaction.
Integrating customer journey metrics with NestAds
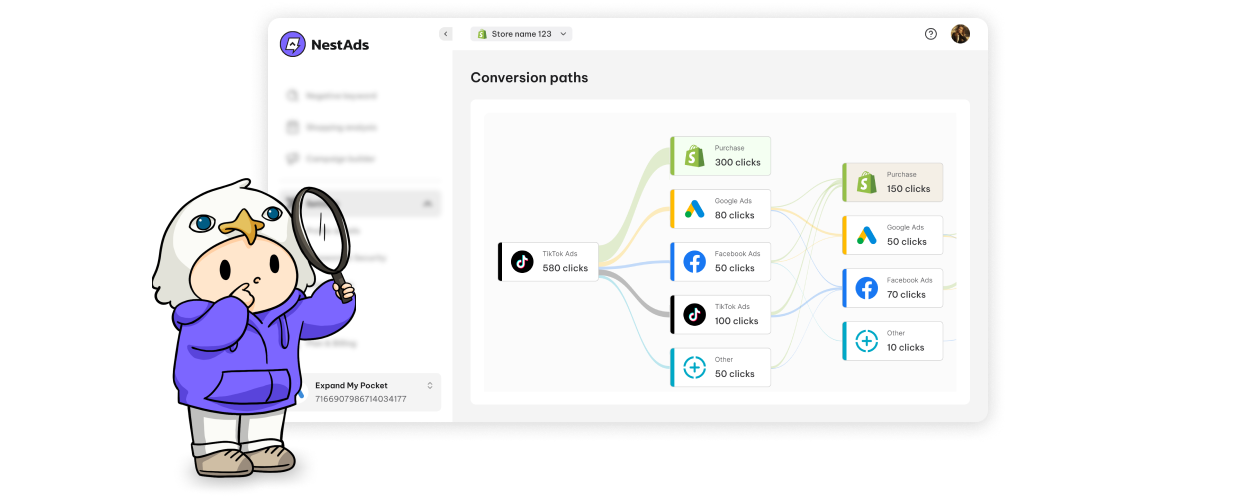
For merchants looking to track these metrics effortlessly, NestAds offers a streamlined solution tailored for Shopify businesses running ads on multiple platforms. NestAds centralizes your data from Facebook, Google, and TikTok, providing a single dashboard to visualize your customer journey metrics. By using NestAds, you’ll be able to have:
- Attribution model flexibility: Customize how each touchpoint is valued, allowing you to track the impact of different channels.
- Comprehensive data view: See metrics like ROAS, CPA, and channel conversion rates.
- Creative insights: Discover which ad creatives work best for your audience, enabling you to optimize your strategy for maximum impact.
With NestAds, you can take the guesswork out of tracking customer journeys, making it easier to make decisions that drive growth.
Ready to harness the power of customer journey metrics?


