
Tracking your store’s Average Order Value (AOV) in GA4 is essential for understanding customer spending behavior and optimizing your marketing strategies.
In this guide, I’ll walk you through different methods to find AOV in GA4. I know it can be a bit tricky, but trust me, once you get the hang of it, you’ll be able to unlock valuable insights about your customers.
Can you find the average order value in GA4?
Well, the answer is a bit of both. Within the latest version, Google doesn’t directly provide users with this metric. If you’re a Shopify merchant, I’d recommend checking your Shopify Analytics – the data there tends to be more accurate.
However, if you prefer to keep everything centralized within GA4, there are a couple of alternative options: using Average Revenue Per User (ARPU) or creating your own metrics within GA4.
Option 1: Finding ARPU in GA4
Method 1: Using the GA4 Interface
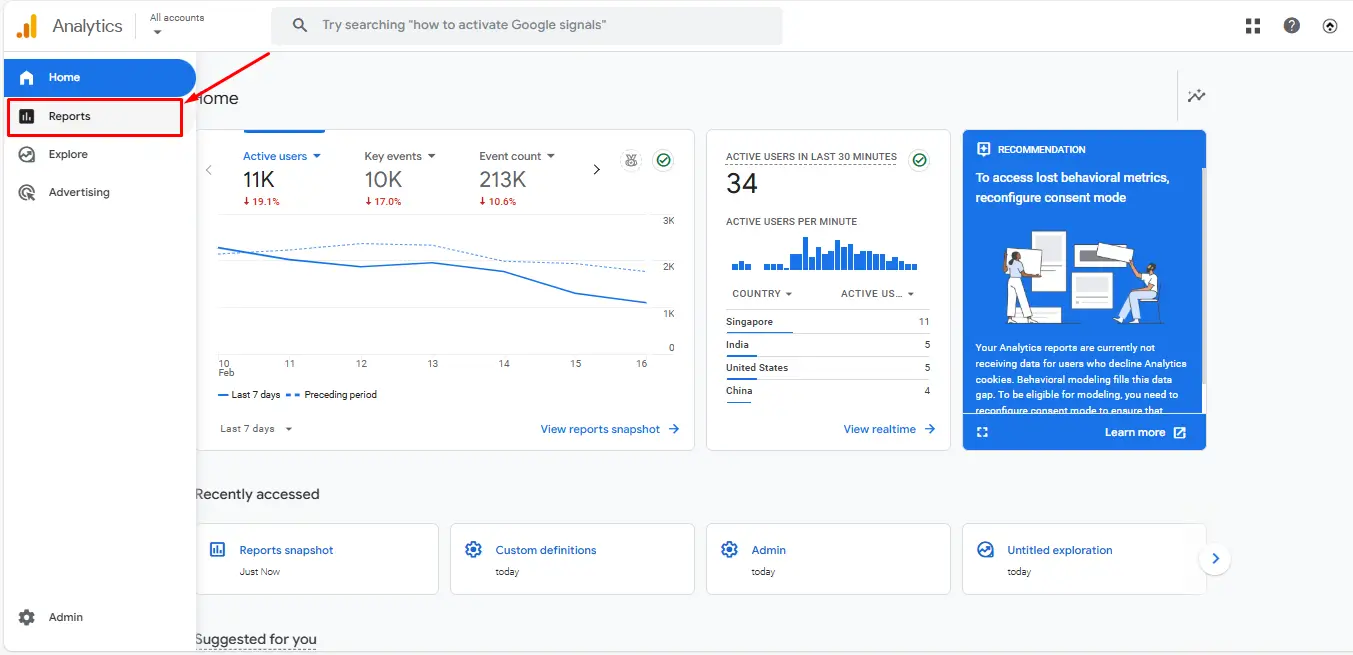
1. Go to GA4 and open your property.
2. Click on Reports in the left-hand menu.
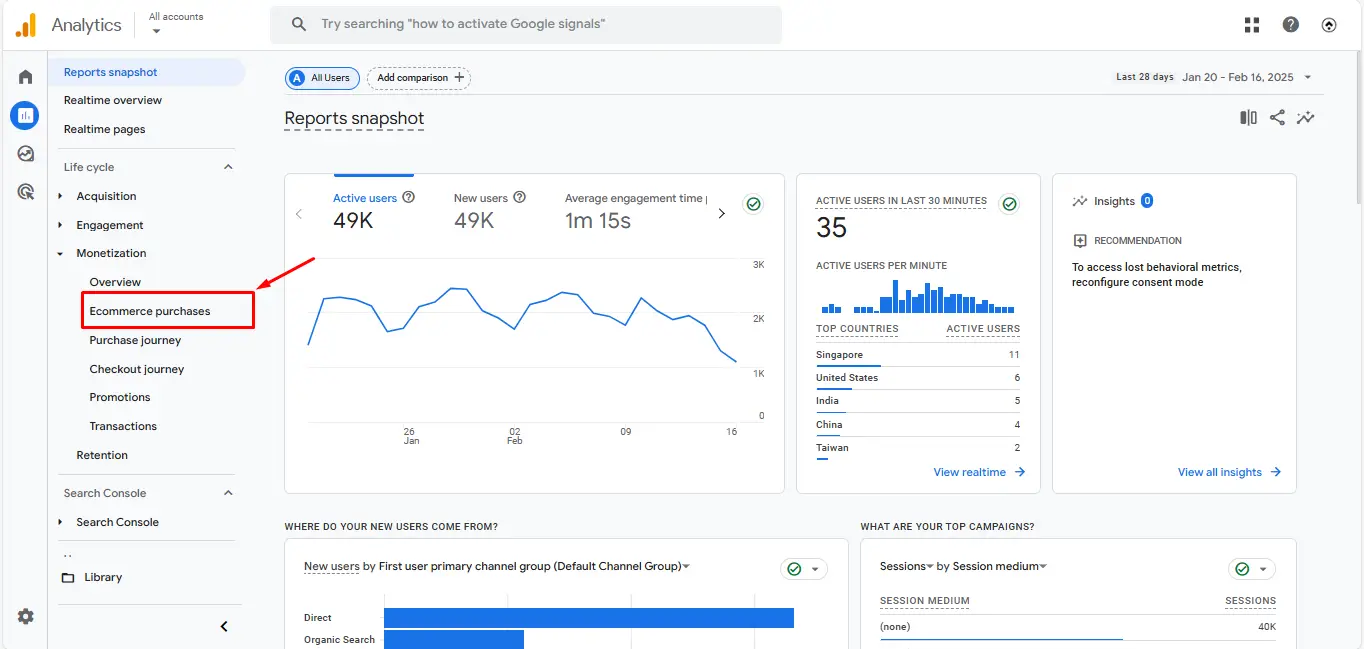
3. Under Monetization, select Ecommerce purchases.
4. Click Edit
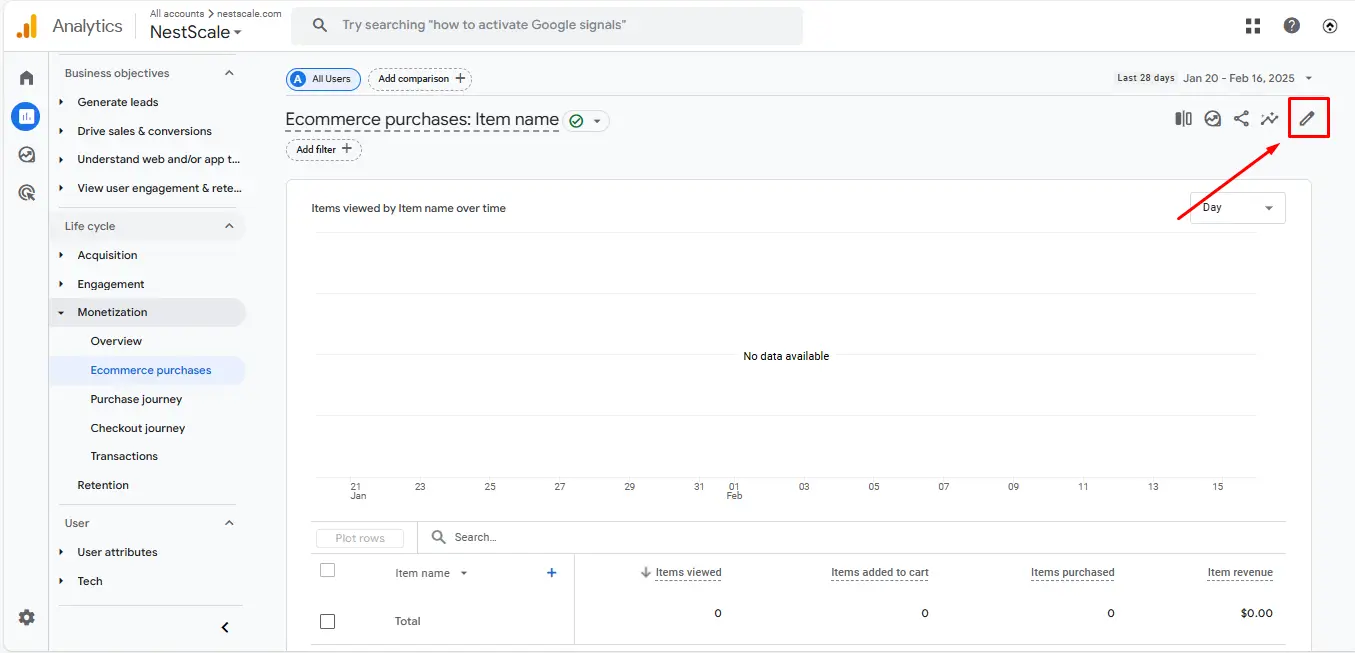
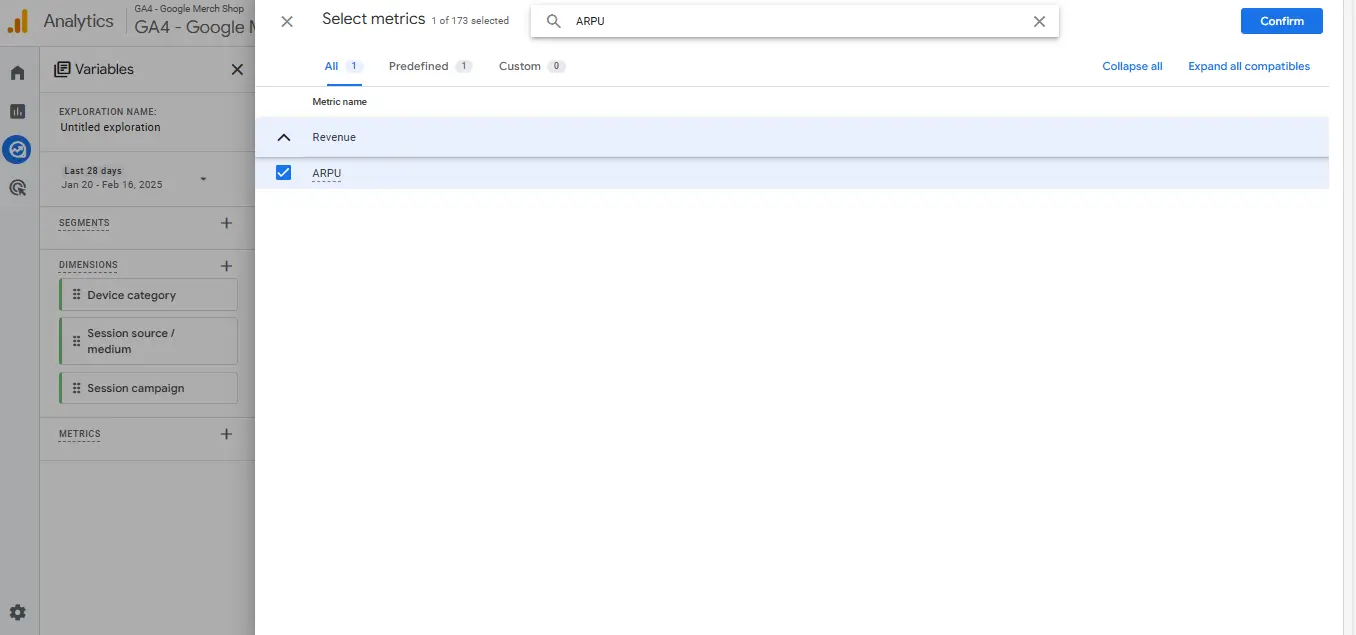
5. Select Metrics
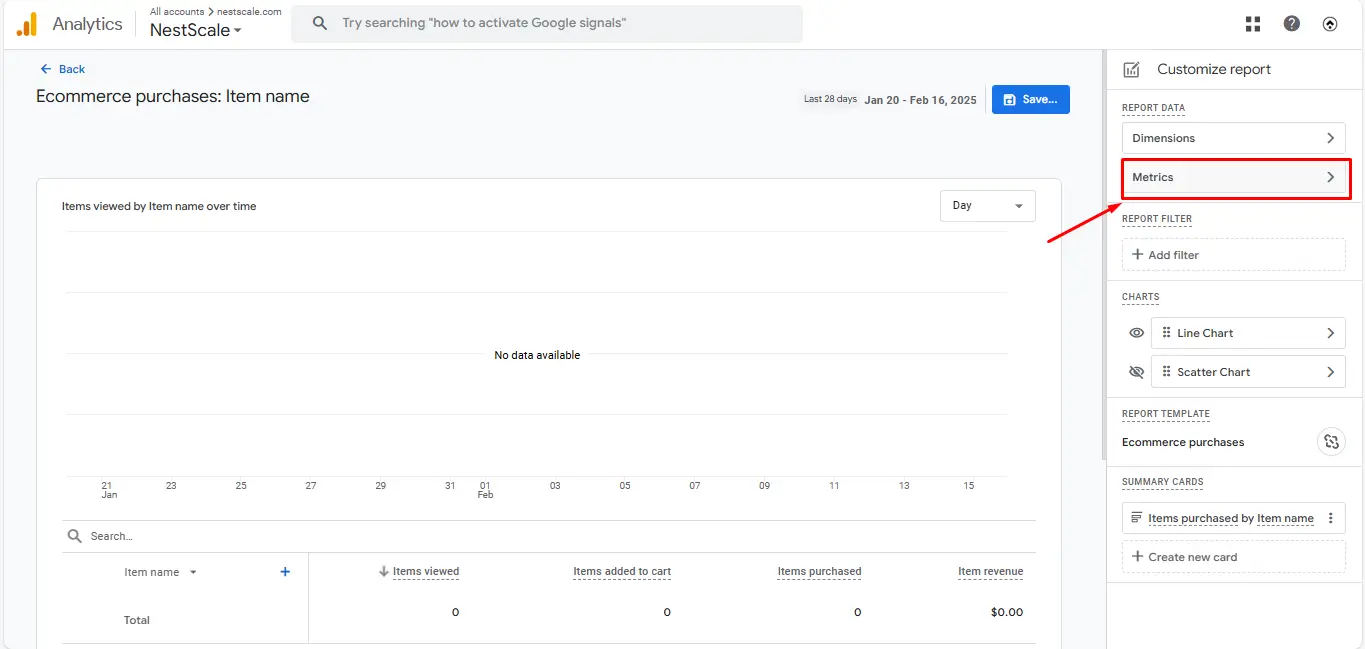
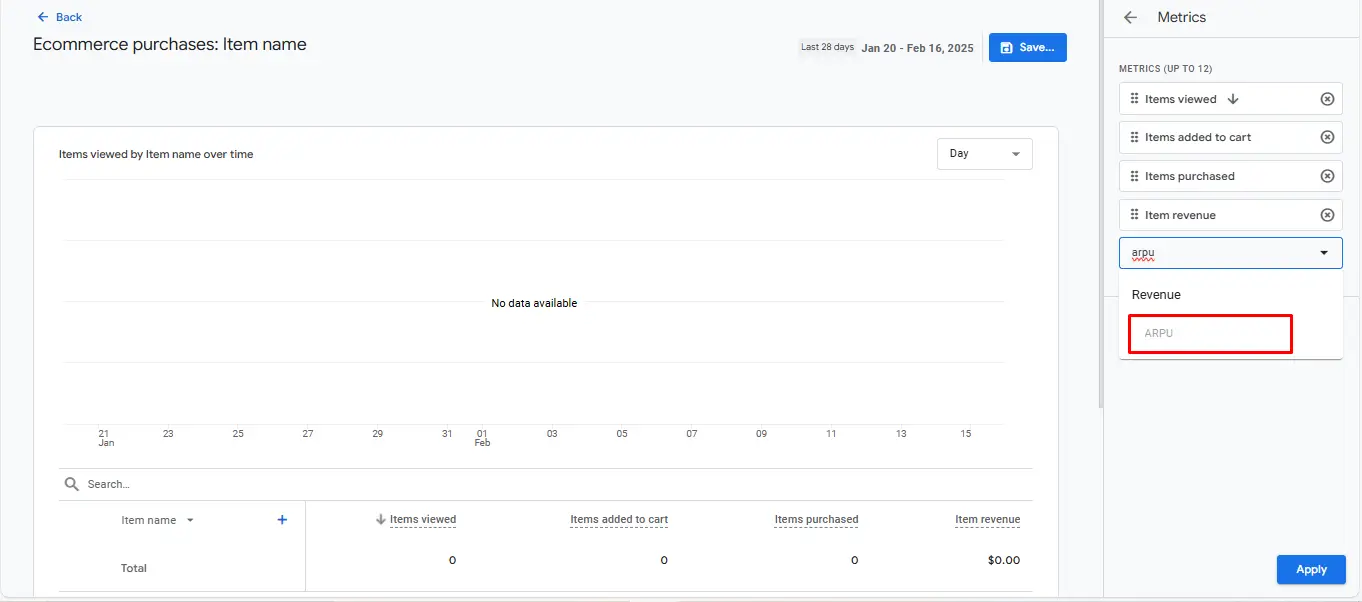
6. Search for ARPU
Method 2: Using Exploration Reports
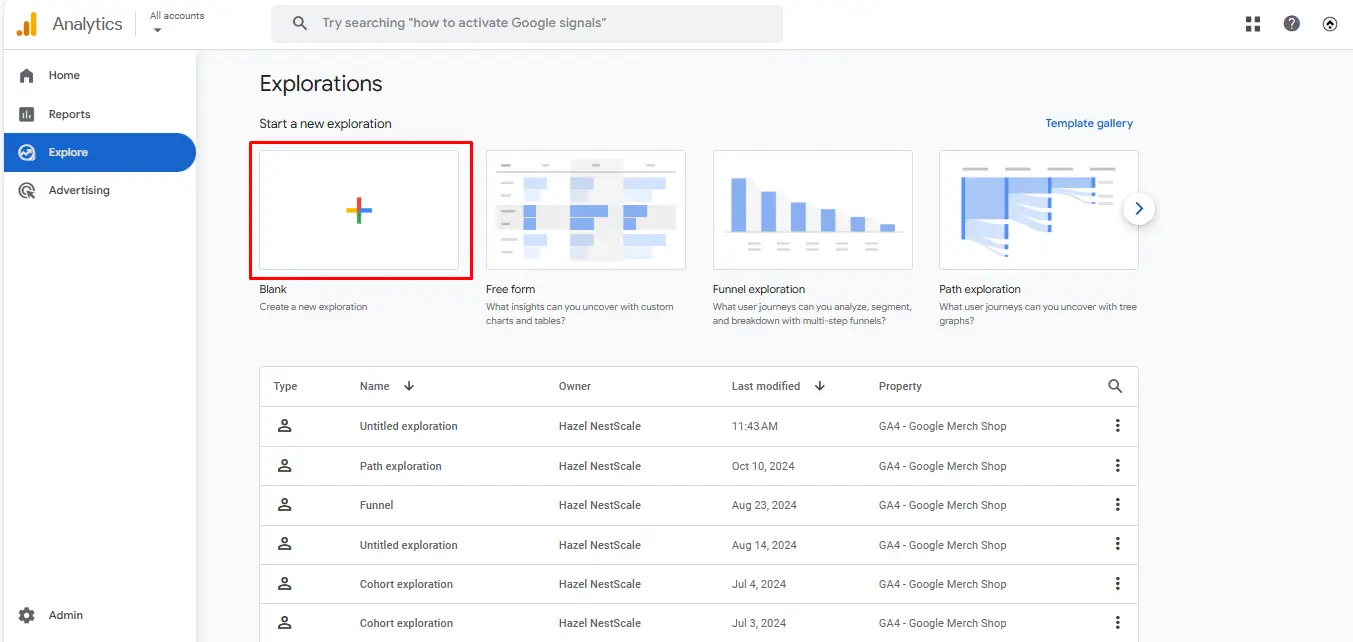
1. Go to Explore and create a blank report
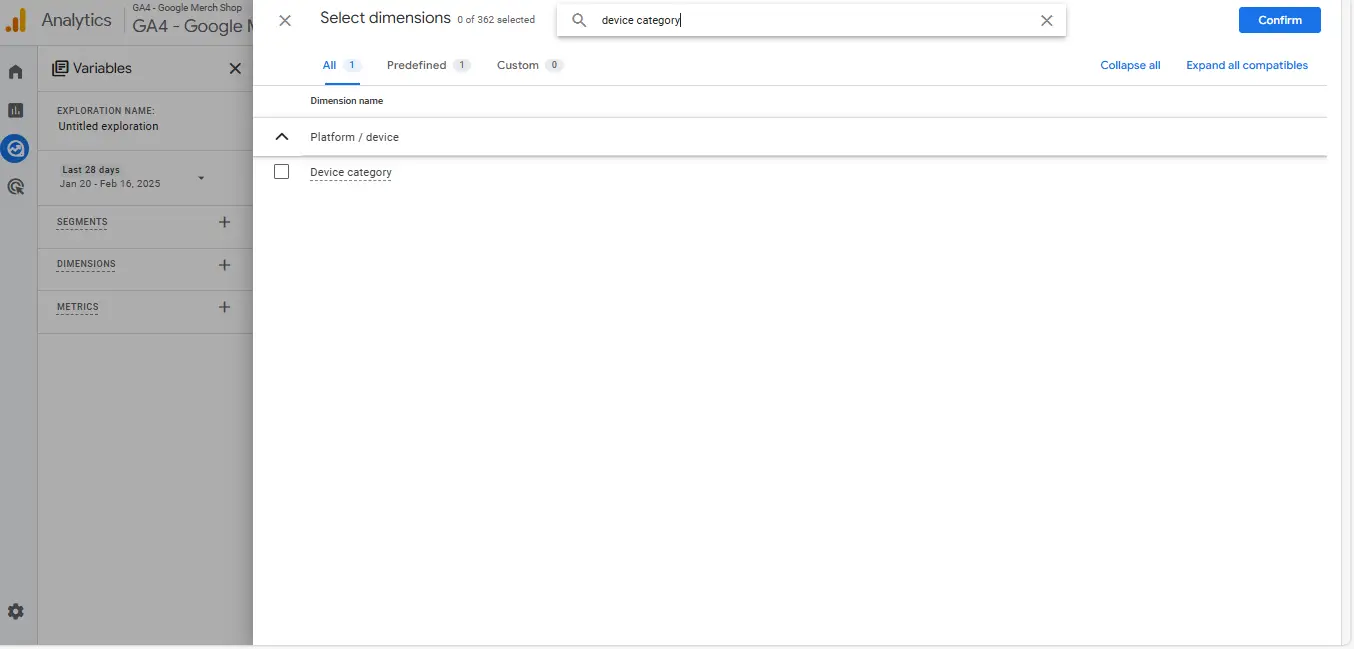
2. Add Dimensions, and select Device category, Session source/medium, and Session campaign to the report. (Or choose whichever Dimensions you want to get insights from)
3. Next, Add Metrics, and import ARPU to your report.
4. Now, drag your Dimensions into the Rows section, and ARPU to the Values section.
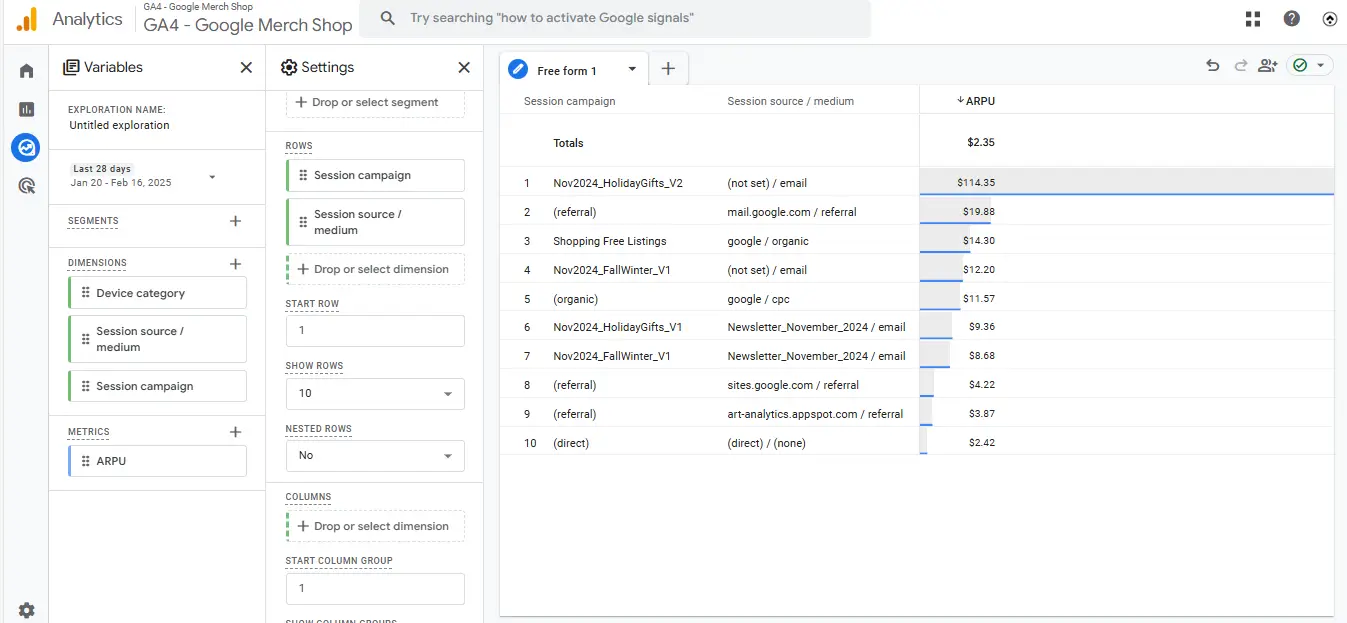
6. Adjust filters and breakdowns as needed.
💡Note: While using ARPU might seem more convenient and save you time, it’s not a perfect substitute for AOV. ARPU is calculated based on users, not the number of orders. This can sometimes inflate the metric and prevent you from getting accurate insights for making informed optimization decisions.
So, if your main goal is to track the impact of your current marketing efforts on acquiring customers, ARPU can be a decent alternative to AOV.
However, if you’re aiming to optimize campaigns, plan upselling and bundling strategies, or even implement retargeting campaigns, you should definitely consider the second option: creating your own metrics to measure AOV.
Option 2: Create your own metrics within GA4
This option will be most accurate if you’re tracking only one key event, specifically a purchase. If you have multiple key events set up in GA4, I recommend turning them off to ensure your data remains accurate.
By default, GA4 sets purchase as the key event.
After have ensured that your key event is right, is time to follow the next step:
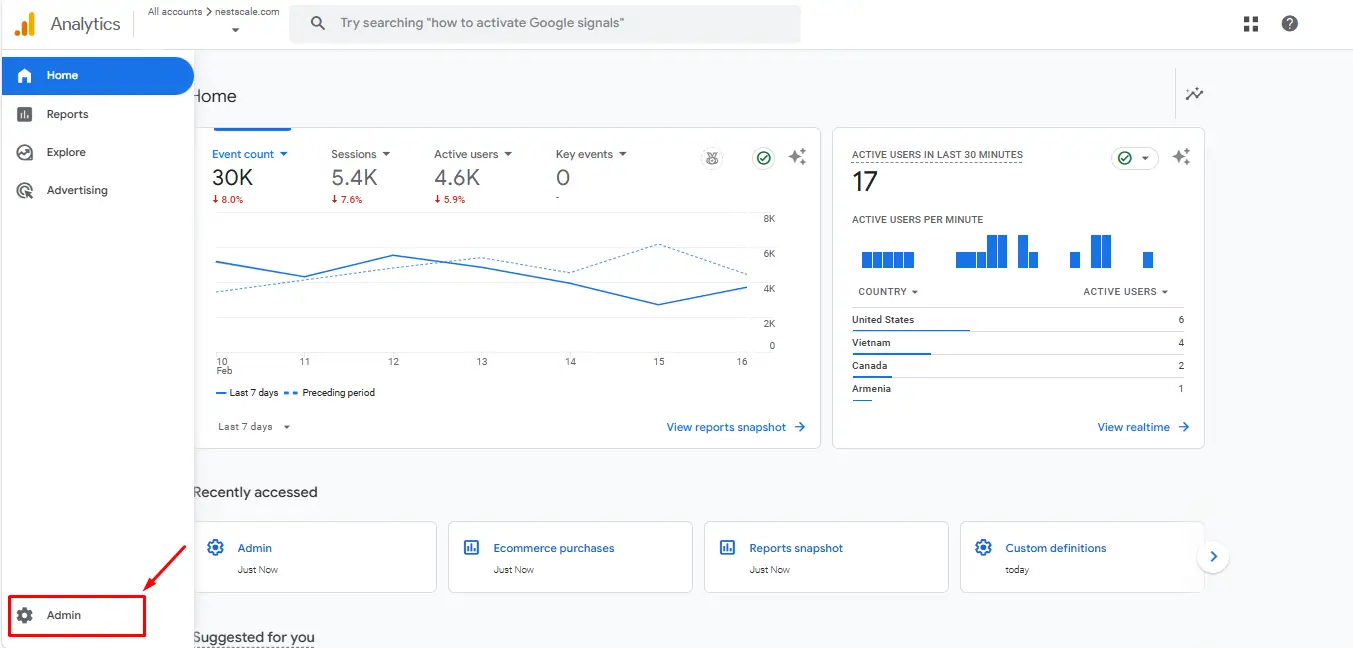
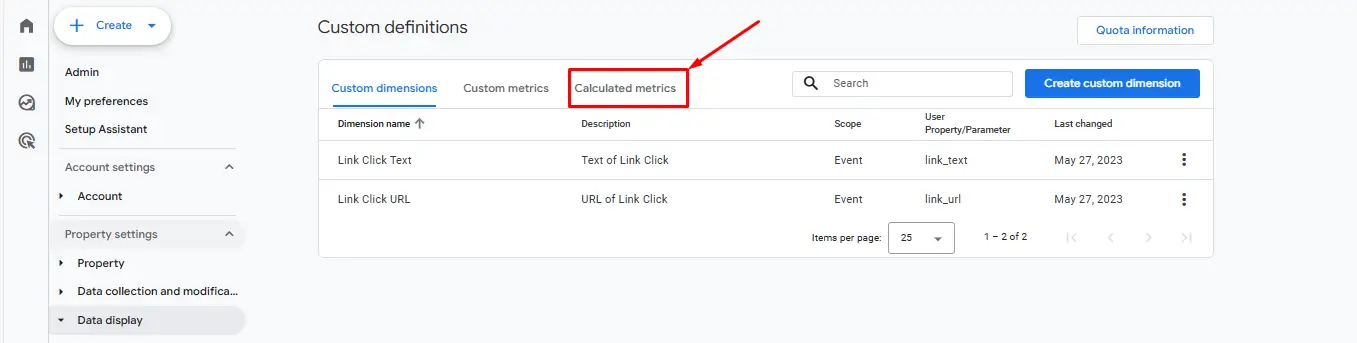
1. Go to your Admin
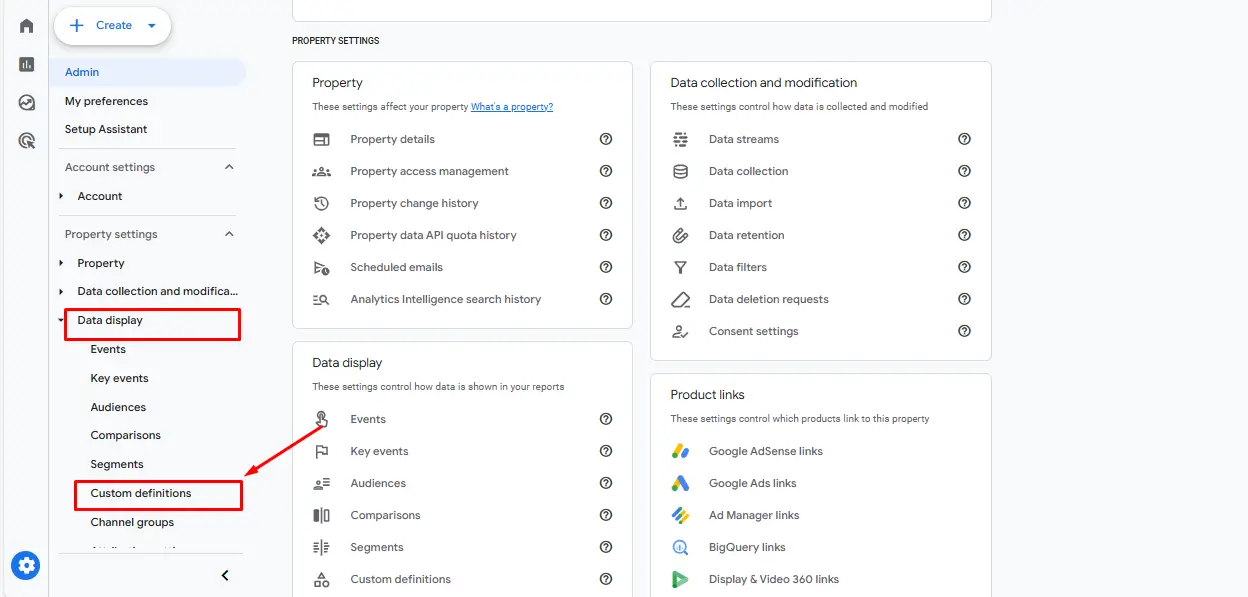
2. In Data display, click Custom definition
3. Choose Calculated metrics
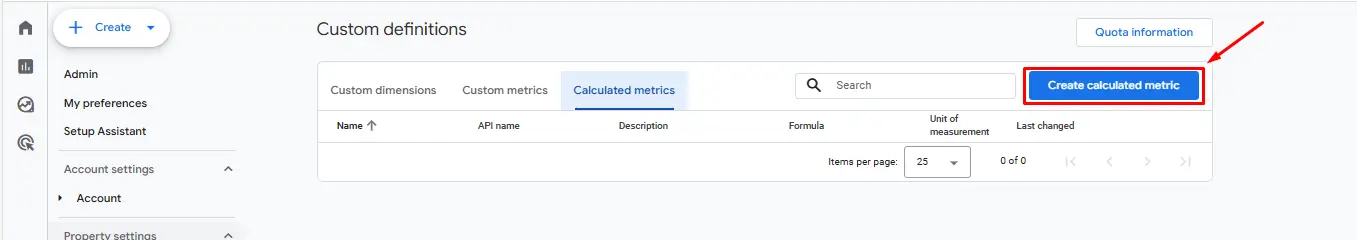
4. Click on Create calculated metric to create your own new metric
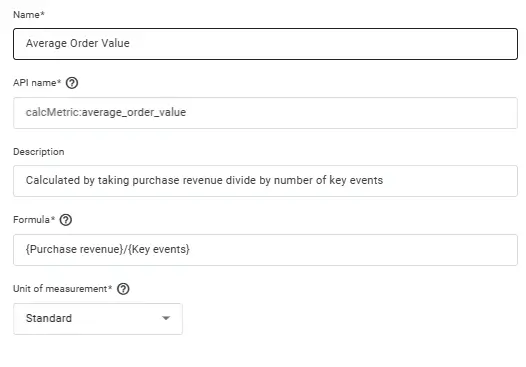
5. Now, fill the field with your information:
- In the Name field, name your new metric as Average Order Value.
- Fill in your description with the description you want to describe your metrics. It’s optional, but I recommend you to fill it in for further tracking in the future.
- For the Formula field, use this formula below: Average order value = Purchase revenue/Key events
6. Click Save.
Now, whenever you customize your report and add a new metric, you’ll always be able to see this new metric.
Why you should measure AOV
- Understand customer behavior: AOV provides insights into how much customers spend per transaction.
- Identify trends: Tracking AOV over time can reveal trends in customer spending.
- Evaluate marketing strategies: See how different campaigns impact AOV.
- Make informed decisions: AOV helps inform decisions related to pricing, promotions, and product offerings.
- Increase revenue: By understanding AOV, businesses can implement strategies to encourage customers to spend more per order. Offering product suggestions, free shipping, and upselling at checkout can help increase AOV.
I hope this helps you navigate the world of AOV in GA4! Once you have a handle on it, you can really start to improve the performance of your online store.