What is attribution reporting?
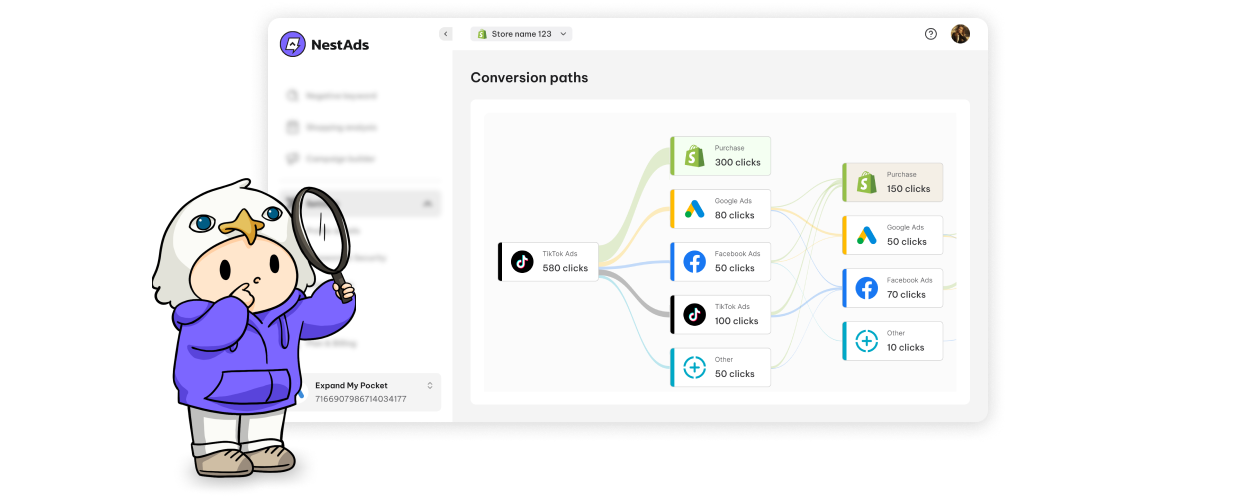
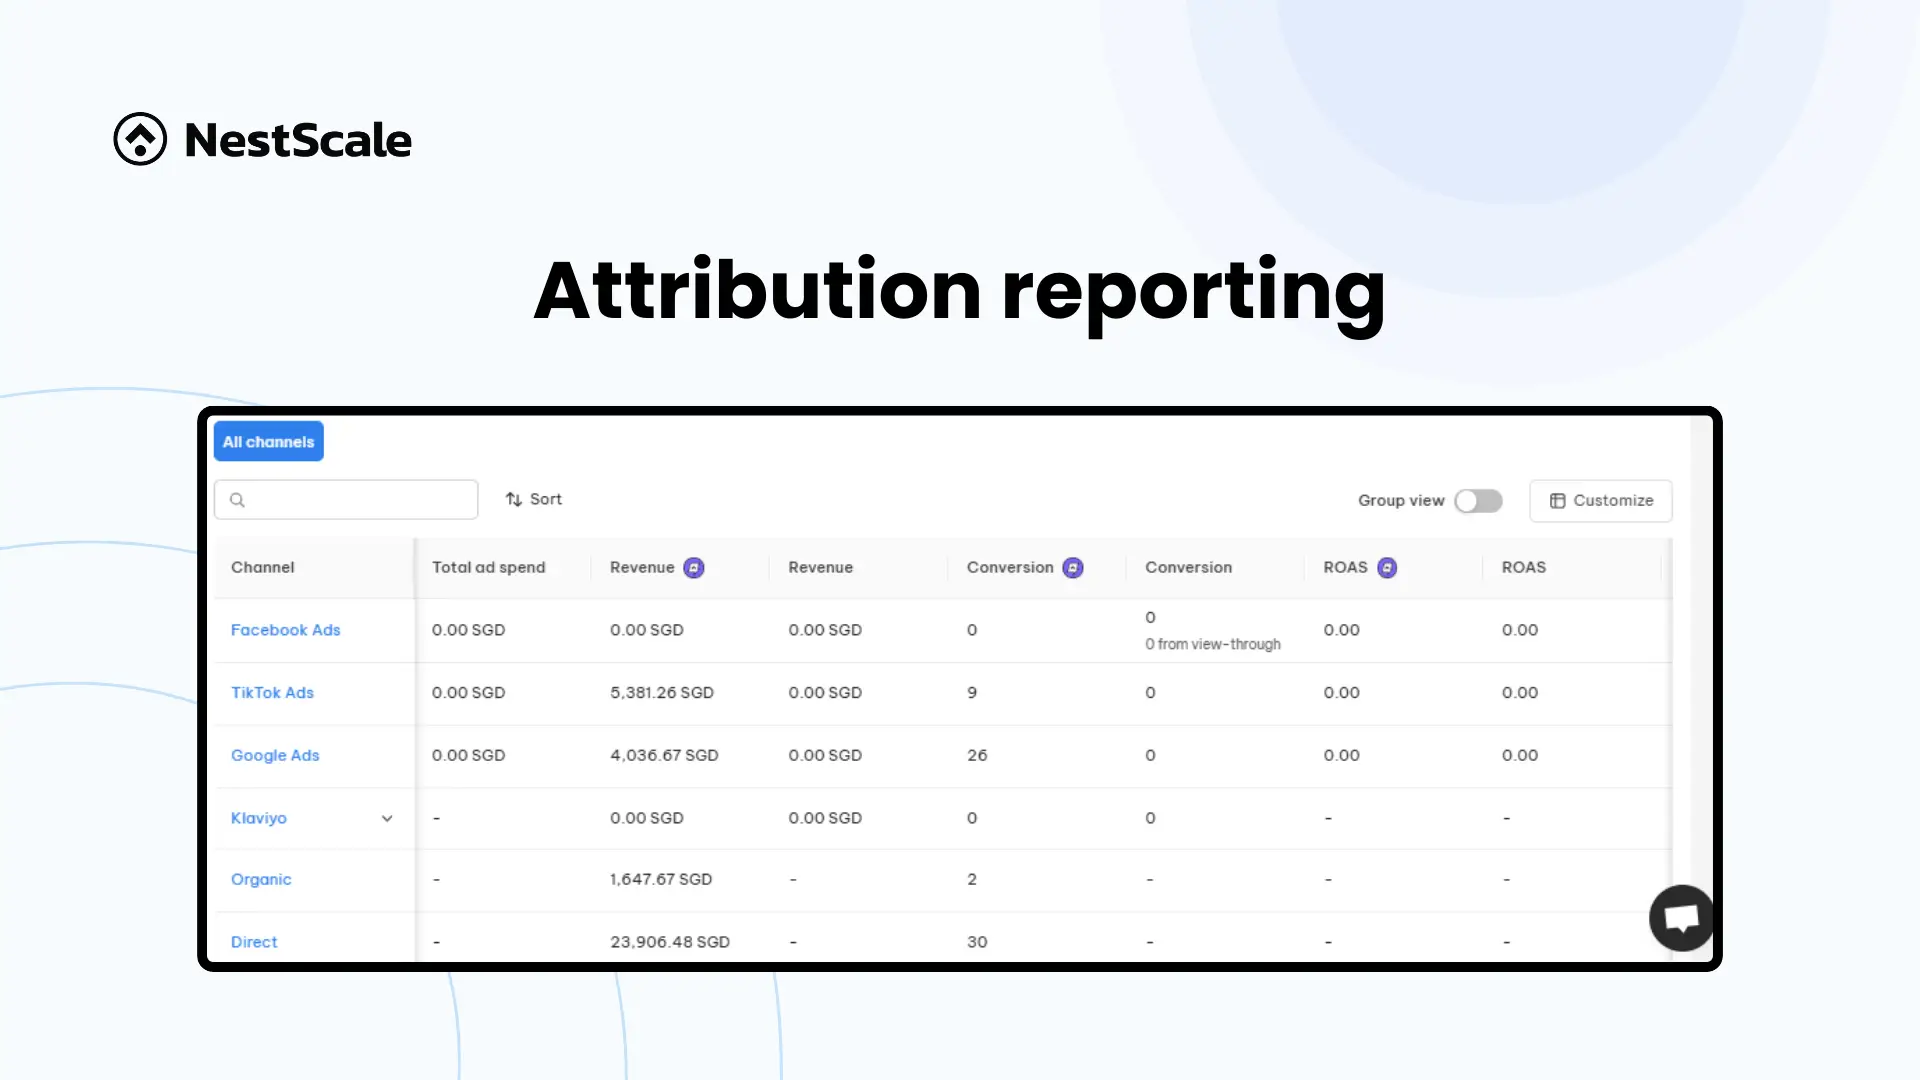
Attribution reporting is the process of analyzing and visualizing how credit for conversions is distributed across the various touchpoints in a customer’s journey. It helps businesses understand which marketing channels, campaigns, or strategies contribute most effectively to sales or other key actions, offering a clear view of how customers interact with your brand.
Why is attribution reporting important?
In today’s multi-channel marketing landscape, customers engage with brands through a mix of ads, emails, social media, and more before making a purchase. Attribution reporting provides insights that help you:
- Evaluate channel performance: Identify which platforms drive the most value.
- Optimize ROI: Understand which efforts yield the best return and allocate budgets effectively.
- Enhance customer journey: Pinpoint areas where customers engage most and improve their experience.
- Make data-driven decisions: Gain actionable insights to refine your marketing strategies.
How does attribution reporting work?
Attribution reporting relies on data collected from various marketing channels and customer interactions. It distributes credit for conversions based on the attribution model you use, such as:
- First-click attribution: Assigns all credit to the first interaction.
- Last-click attribution: Gives full credit to the final touchpoint.
- Linear attribution: Splits credit equally among all interactions.
- Time decay attribution: Assigns more credit to touchpoints closer to the time of conversion.
- Position-based (U-shaped) attribution: Gives the highest credit to both the first and last touchpoints, while the remaining is distributed equal credit.
- Data-driven attribution: Machine learning is used to determine the impact of each touchpoint.
For example, if a customer clicks on a Google ad, visits your website via a blog, and converts after clicking an email, the attribution model will decide how much credit each channel receives. Using the last-click attribution, 100% credit will be distributed to email, while with linear attribution, each touchpoint will receive 33% credit.
Key metrics to track in your attribution report
To get the most out of your attribution reporting, it’s important to focus on the right metrics. These key data points help you understand how different touchpoints in your customer journey contribute to conversions and overall marketing success. Here are the essential metrics to track:
| Key metrics | Why? |
| Conversion rate | This is the percentage of visitors who complete a desired action. Tracking conversion rates across different touchpoints shows which channels are most effective in driving actions. |
| Click-through rate (CTR) | CTR measures how often people click on your ad or link compared to how many times it’s shown. A high CTR indicates that your ads are capturing attention |
| Cost per acquisition (CPA) | CPA calculates how much it costs to acquire a customer through a specific touchpoint or campaign. This metric helps you assess the profitability of your marketing efforts. |
| Customer lifetime value (CLV) | CLV shows how much revenue a customer is likely to generate over their entire relationship with your brand. By tracking CLV, you can evaluate which touchpoints bring in high-value customers. |
| Return on ad spend (ROAS) | ROAS measures how much revenue you generate for every dollar spent on advertising. It’s a key metric to assess the direct impact of your paid campaigns in driving sales. |
Benefits of attribution reporting
- Clarity on marketing impact: Understand which efforts directly influence conversions.
- Better budget allocation: Shift resources to the channels driving the highest returns.
- Holistic view of customer behavior: See how different touchpoints work together in the customer journey.
- Improved campaign performance: Refine underperforming strategies and double down on what works.
Tools for attribution reporting
To create effective attribution reports, businesses use tools that integrate data from multiple platforms, such as:
- Google Analytics 4 (GA4): One of the most widely used analytics tools today, it offers customizable attribution models and detailed reports. However, it can be challenging for beginners to set up and lacks some eCommerce-specific metrics.
- Native ad platforms: Tracks and reports on the touchpoints happening on the platforms only. You can find the attribution reports within Meta, TikTok, Amazon, etc.
- Third-Party Tools: Provide a neutral, cross-channel view of marketing performance.
These tools simplify the reporting process and provide actionable insights for businesses of all sizes.
FAQs
Q1: Is attribution reporting useful for small businesses?
A: Absolutely! Attribution modeling is incredibly valuable for small businesses. It helps them understand which marketing channels are driving conversions, enabling smarter decisions, better budget optimization, and a sharper focus on strategies that produce the best results.
Q2: Can attribution reporting track offline touchpoints?
A: Some advanced tools can integrate offline data, such as in-store purchases or phone calls, for a complete view of the customer journey.
Q3: How often should attribution reports be reviewed?
A: Regularly – monthly or quarterly – to adapt to changing customer behavior and campaign performance.


